Gold : Silver
1 oz gold = 74.5 oz silver
Within its typical range of 59.6 to 78.6
26 October 2026: 1 oz gold = 74.5 oz silver
One troy ounce of gold was worth 74.5 ounces of silver on 26 October 2026.
What an ounce of gold costs, and what it is worth in silver, copper, stocks, and bitcoin.
$4,020.00 USD per oz
Updated
1 oz gold = 74.5 oz silver
Within its typical range of 59.6 to 78.6
26 October 2026: 1 oz gold = 74.5 oz silver
One troy ounce of gold was worth 74.5 ounces of silver on 26 October 2026.
1 S&P 500 = 1.90 oz gold
Within its typical range of 1.52 to 2.35
23 October 2026: 1 S&P 500 = 1.90 oz gold
One unit of the S&P 500 index was worth 1.90 troy ounces of gold on 23 October 2026.
1 oz gold = 618 lb copper
Above its typical range of 359 to 506
26 October 2026: 1 oz gold = 618 lb copper
One troy ounce of gold was worth 618 pounds of copper on 26 October 2026.
1 bitcoin = 19.9 oz gold
Within its typical range of 2.84 to 20.6
26 October 2026: 1 bitcoin = 19.9 oz gold
One bitcoin was worth 19.9 troy ounces of gold on 26 October 2026.
The shaded band is where each ratio spent the middle half of its recorded history. Compare more assets in gold
Each ratio divides one price by another, so no currency is involved. The shaded band in each chart marks where the ratio has spent the middle half of its history; a value outside the band is unusual by the ratio's own record.
Where a home became more expensive in gold over five years, and where it became cheaper.
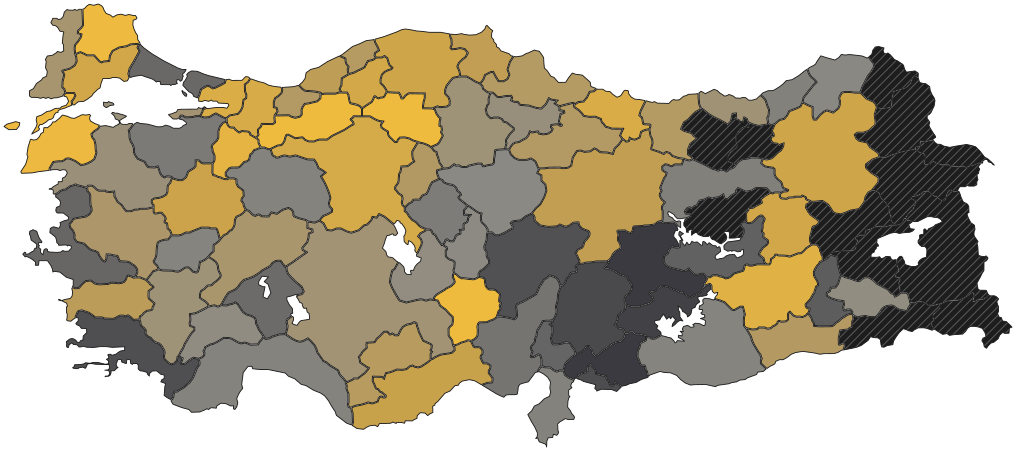
81 provinces
43 of 69 provinces with a figure got more expensive in gold and 26 cheaper.
Explore the map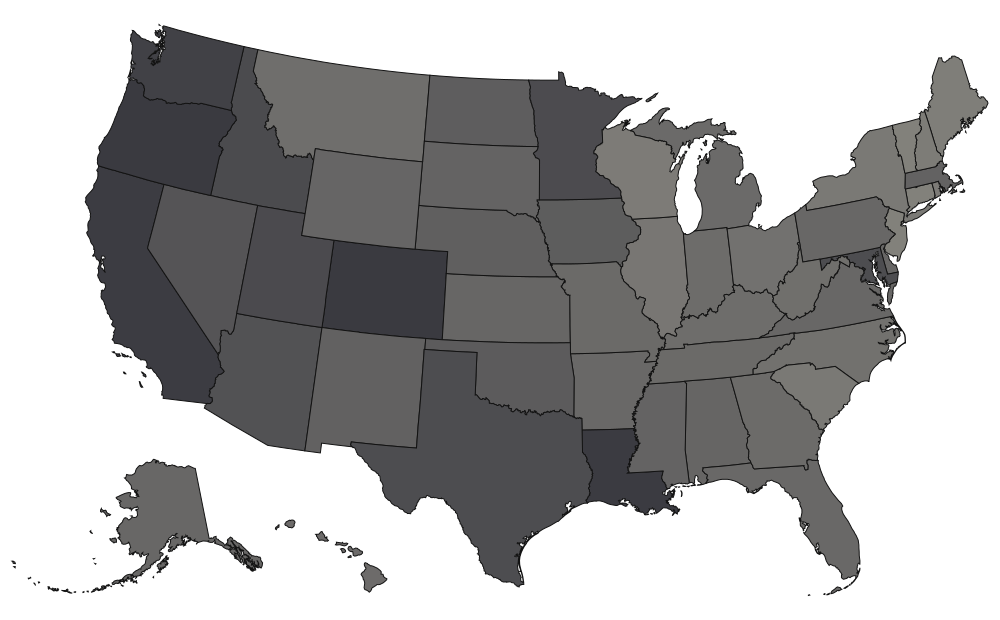
50 states and D.C.
0 of 51 areas with a figure got more expensive in gold and 51 cheaper.
Explore the map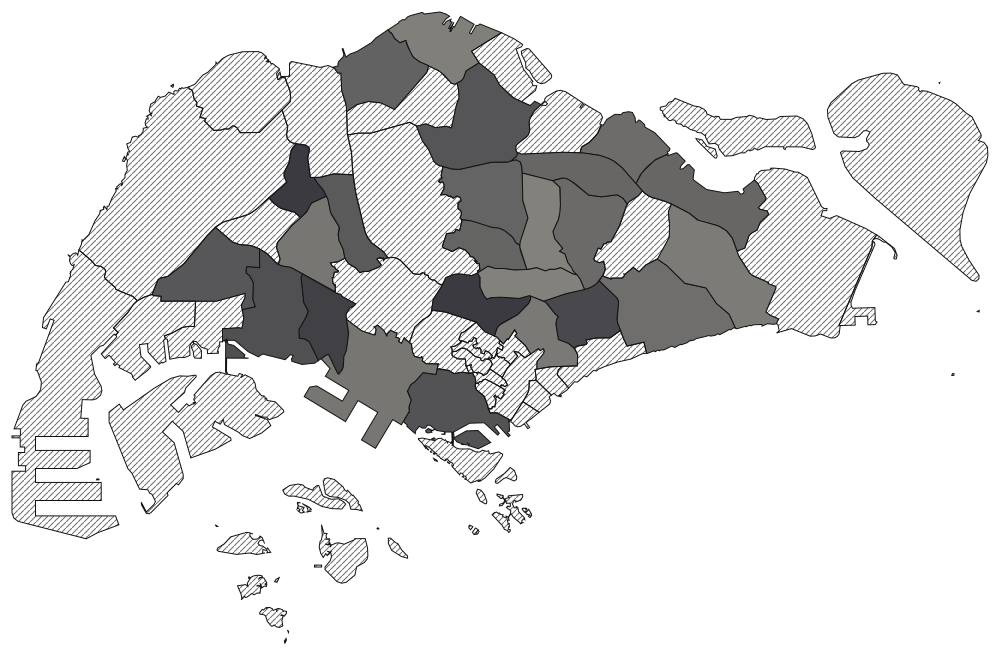
55 planning areas
0 of 24 planning areas with a figure got more expensive in gold and 24 cheaper.
Explore the map
12 regions and nations
0 of 12 regions or nations with a figure got more expensive in gold and 12 cheaper.
Explore the map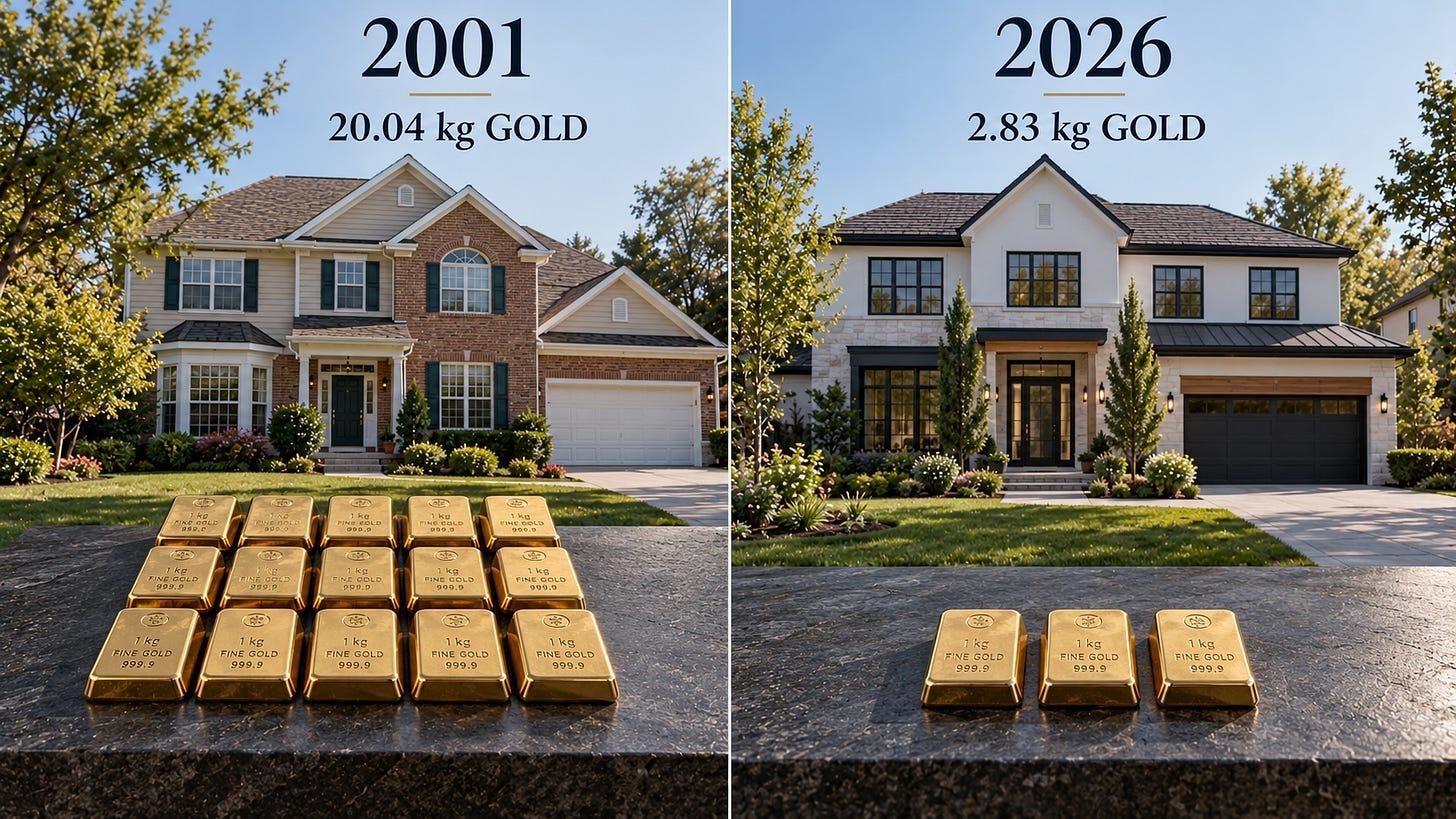
American home prices have more than doubled in dollar terms. In gold, a median new home costs on average 86% less than it did 25 years ago.
Read on Substack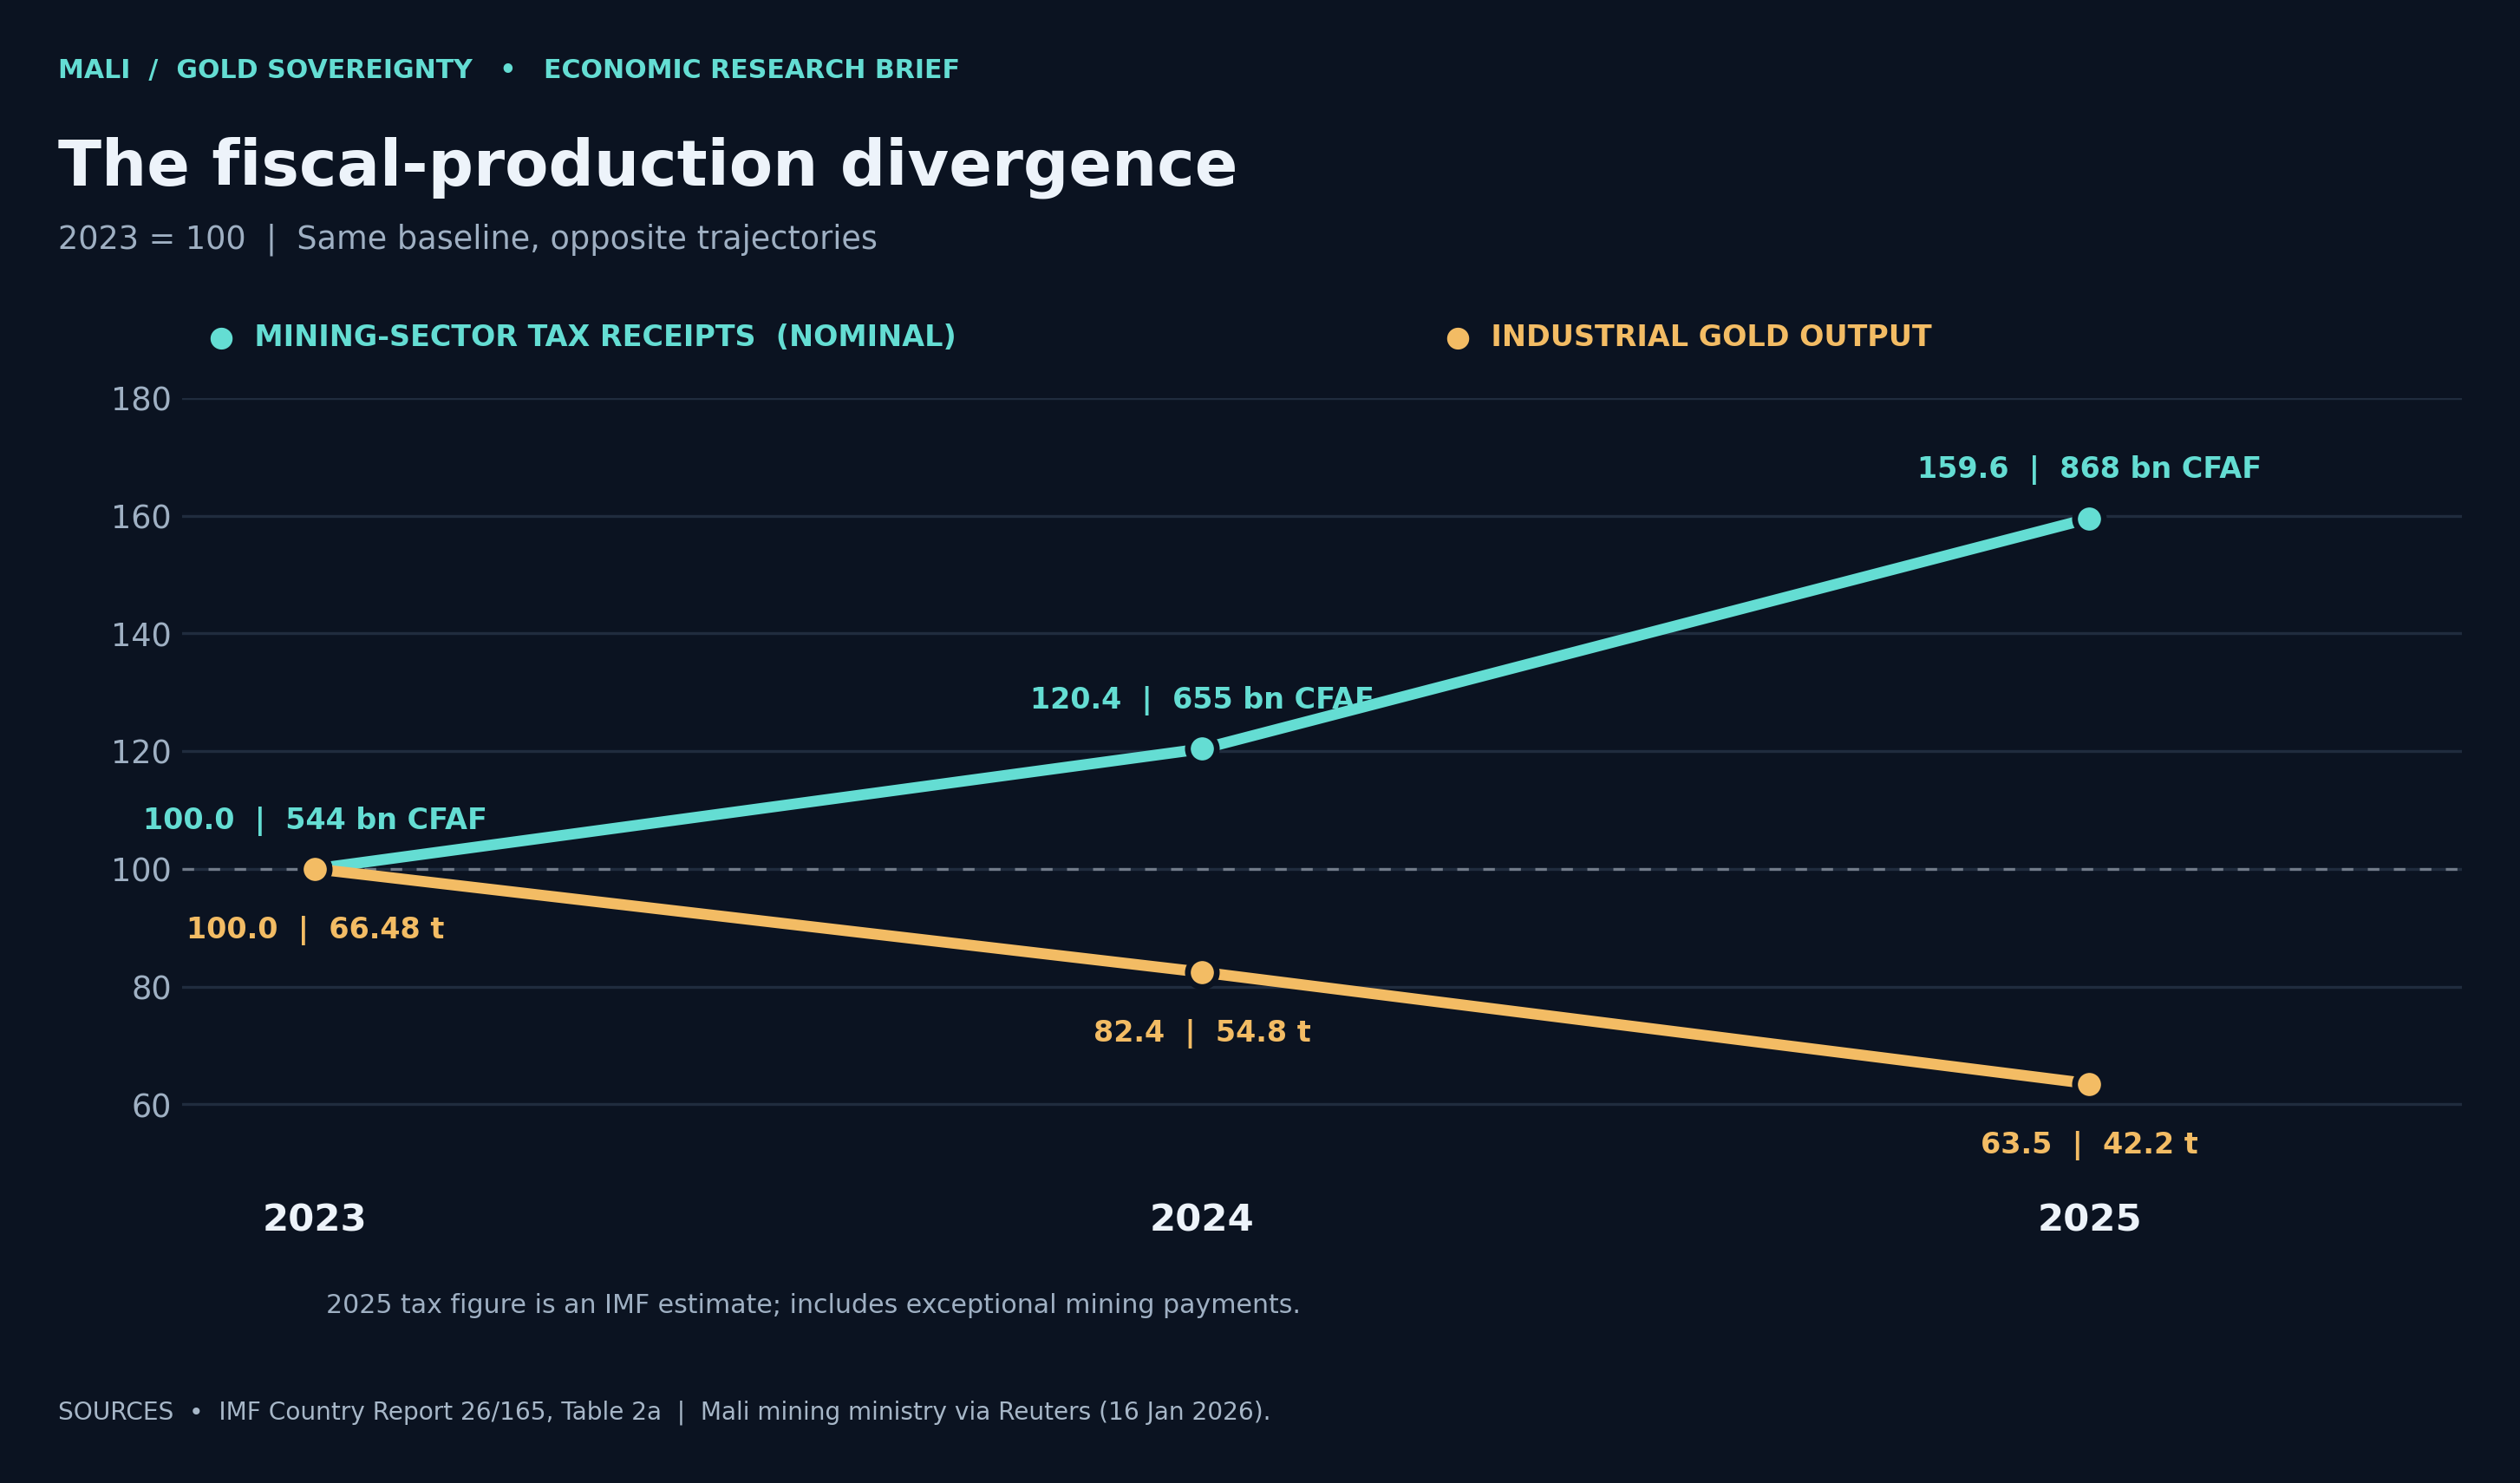
Part I of III — A real bargaining game over taxation, investment and national welfare
Read on Substack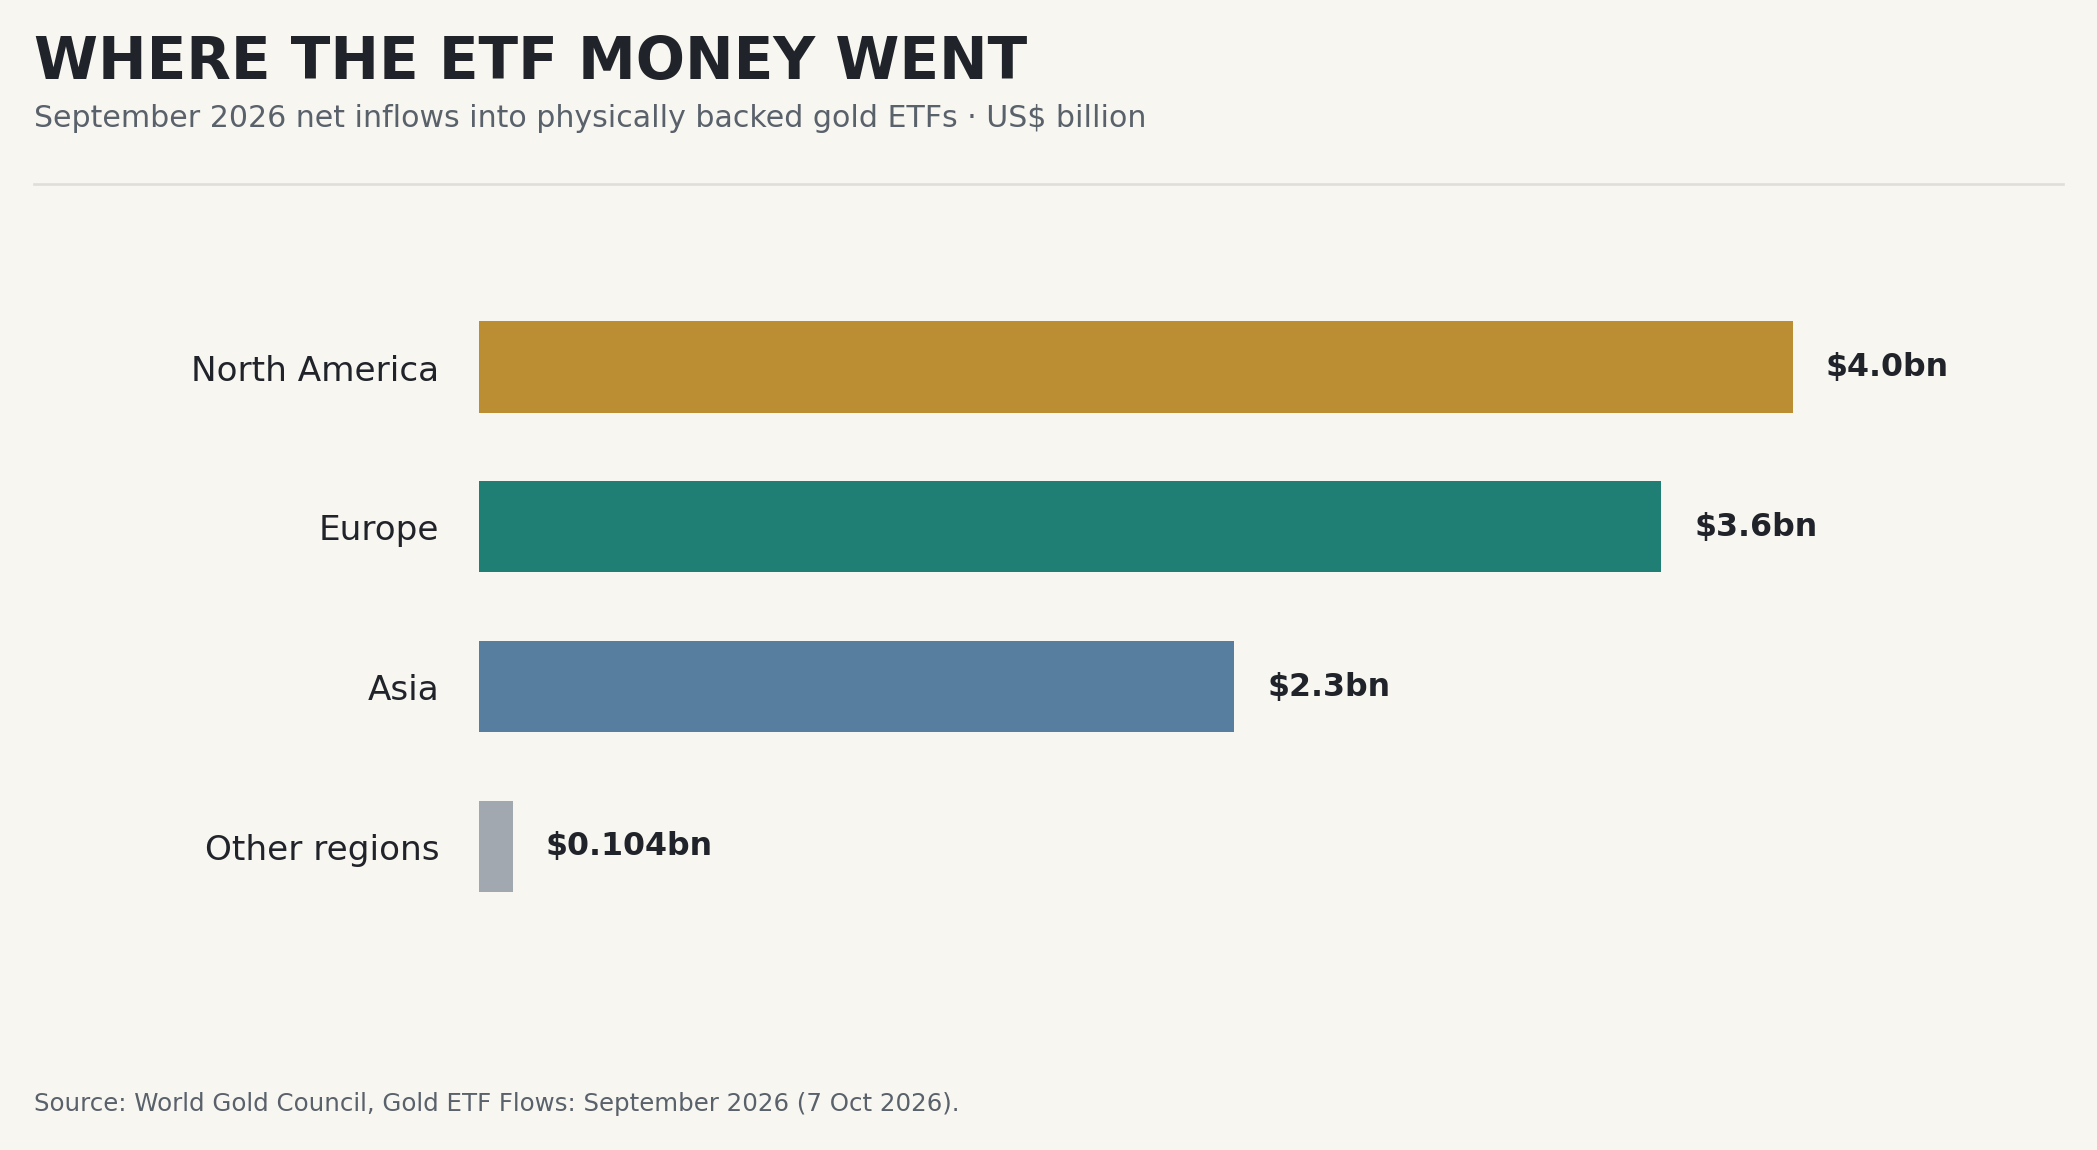
What the September 2026 sell-off reveals about interest rates, ETF flows, central-bank reserves—and the future of gold recovery.
Read on Substack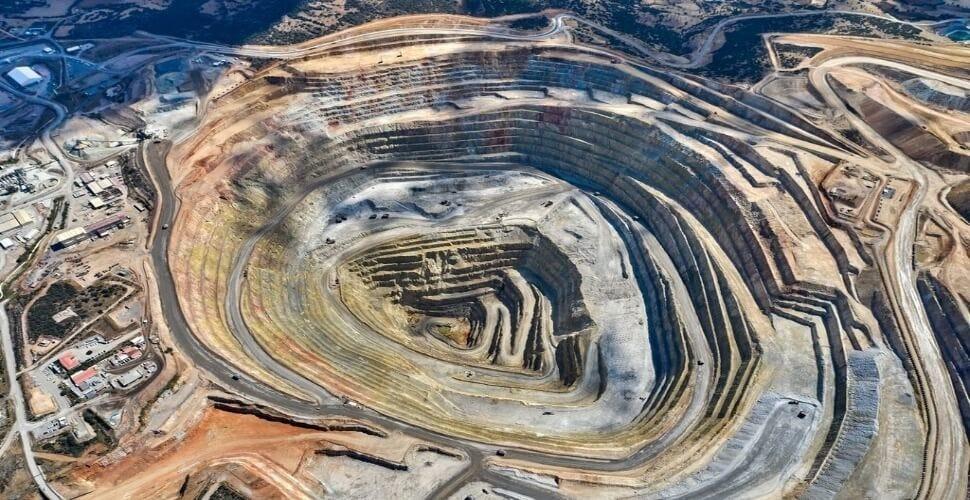
Strong cash flow, high-grade discoveries, and the Skouries ramp-up are turning a steady miner into a more compelling growth story
Read on SubstackStocks, indices, crypto, and commodities priced in ounces instead of dollars.
Compare assets in goldHow much gold a dollar, euro, or yen buys, and how fast that is shrinking.
Compare currencies in goldGDP of the largest economies measured in gold rather than in their own currency.
Compare economies in goldPrices in a currency rise when the currency is diluted. Prices in gold show what changed in real terms.
The same unit for assets, currencies, and economies in any country.
Gold has kept its purchasing power across centuries and monetary systems.
Mining adds about 1.5% to the stock of gold each year.
The price of one troy ounce of gold divided by the price of one troy ounce of silver. How many ounces of silver one ounce of gold buys. A high number means silver is cheap relative to gold, which has often happened in times of stress. A low number means silver has caught up.
The S&P 500 index level divided by the price of one troy ounce of gold. How many ounces of gold it takes to buy one unit of the S&P 500 index. It strips the dollar out of the stock market: when it falls, stocks are losing value against gold even if their dollar price is rising.
The price of one troy ounce of gold divided by the price of one pound of copper. How many pounds of copper one ounce of gold buys. Copper follows industrial demand and gold follows caution, so a rising ratio tends to go with a weakening economy and a falling one with growth.
The price of one bitcoin divided by the price of one troy ounce of gold. How many ounces of gold one bitcoin buys. It compares the newest store of value with the oldest, without any currency in between.
Central banks can create currency without limit, so prices in dollars or euros rise even when nothing has become more valuable. The stock of gold grows by only about 1.5% a year through mining, which makes it a steadier unit for comparing value over time.
The gold price and the four ratios refresh every five minutes from Yahoo Finance quotes. Each value on the page shows the date or time it refers to.
Gold, silver, copper, and the S&P 500 go back to the year 2000. Bitcoin goes back to 2014. The typical range of each ratio is calculated from its full history.
Yes. Every chart and comparison on the site is free.
The site is for information and education only and is not investment advice. Use it as one input alongside your own research or a qualified adviser.