United Kingdom in gold
What the government’s gold, everyday prices, household deposits, homes and the pound look like when measured in gold as well as in pounds.
In short
Change against one year earlier
House prices in gold
−24.8 %
in one year
Q2 2026In dollars +3.5 %In pounds +2.9 %UK government gold
$45.7bn
market value
August 2026In dollars +33.1 %In pounds +32.8 %A £100 basket in gold
1.6
grams of gold
September 2026In gold −12.4 %In pounds +3.4 %Deposits in gold
19,273
tonnes of buying power
August 2026In gold −18.6 %In pounds +3.5 %Gold bought by £100
0.96grams
September 2026In one year −15.4 %In dollars −0.7 %
House prices by region and local authority, in gold
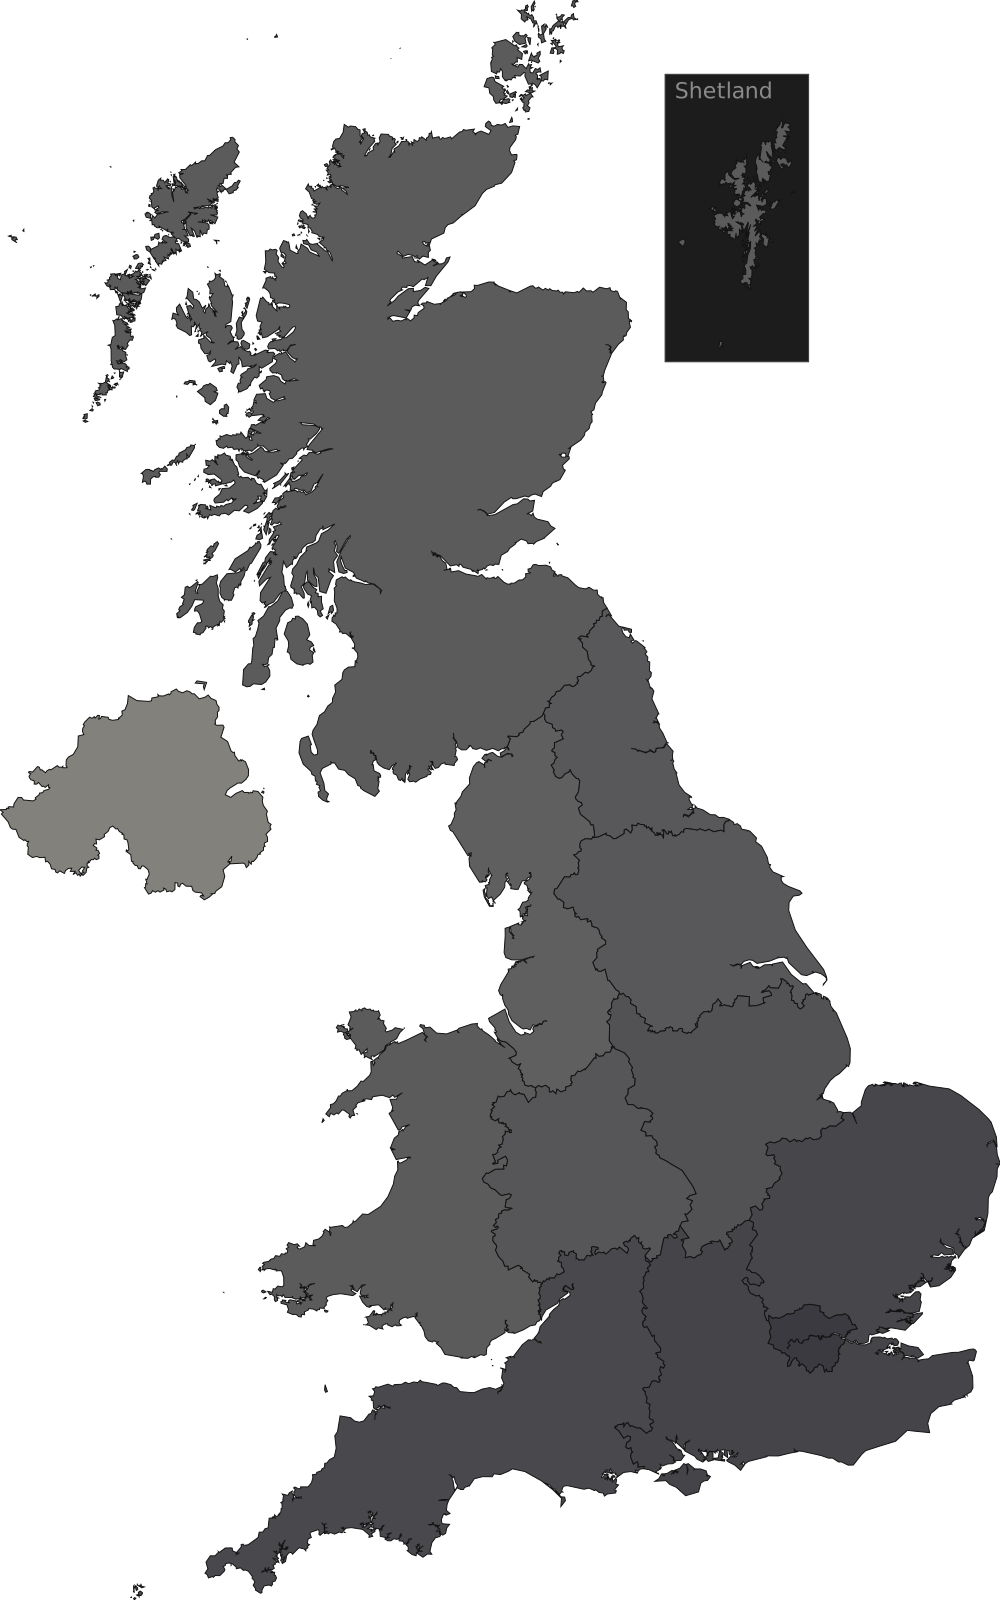
From Q2 2021 to Q2 2026, 0 of 12 regions or nations with a figure got more expensive in gold and 12 cheaper.
Gold shows a rise, graphite a fall, and a hatched area has no figure for this period.
Explore the map of house prices by region and local authorityHouse prices
In Q2 2026 the average UK home cost £271,292, US$364,200 or 2.5 kg of gold; against a year earlier that is −24.8 % in gold, +3.5 % in dollars and +2.9 % in pounds.
Actual amounts: pounds on the left axis, kilograms of gold on the right.
Q2 2026
- Average home · pounds£271,292
- Average home · kilograms of gold2.5 kg
Show as table
What you see
The chart shows the average price of a home in pounds, in US dollars and in kilograms of gold, each quarter at its own average rate and gold price. Combined puts pounds on the left axis and gold on the right.
What it means
A home can cost more pounds and less gold at once. The changes in the sentence come from the UK House Price Index, so they equal the map of regions and local authorities below; the levels are the published average prices, so the ratio of two levels can differ slightly from the stated change.
Which homes does the index cover?
- The UK House Price Index (HM Land Registry, ONS, Registers of Scotland and LPS Northern Ireland) is hedonic and mix-adjusted, for all property types, not seasonally adjusted. Each quarter is the mean of its three monthly values.
- The latest twelve months are revised with each publication.
Q2 2026: £271,292, US$364,200, 2.5 kg; against a year earlier −24.8 % in gold, +3.5 % in dollars and +2.9 % in pounds. UK HPI of 2026-08.
Explore house prices by region and local authorityThe UK government’s gold
In August 2026 the UK government’s gold was worth $45.7 billion (£33.7 billion), +33.1 % against a year earlier in dollars. That is an estimated 310 tonnes of gold, worked out from the dollar value.
Actual amounts: pounds on the left axis, estimated tonnes of gold on the right. The tonnes are the dollar value divided by the month-end gold price, not a published holding.
August 2026
- Market value · billion GBP£33.7bn
- Estimated gold · tonnes317 t
Show as table
What you see
The chart shows the market value of the gold at the end of each month, in US dollars or in pounds. The Gold view shows the tonnes that value implies, the dollar value divided by the month-end gold price, and Combined puts pounds on the left axis and those tonnes on the right. The Bank of England publishes the value, not a weight we may use, so these tonnes are an estimate.
What it means
A rising value can describe the same gold at a higher price rather than a larger reserve. The government owns the gold through the Exchange Equalisation Account, which HM Treasury oversees; the Bank of England manages it as its agent and keeps the gold in its vault.
About the gold figures
- The series is the Bank of England’s monthly amount outstanding of central government gold in US dollar millions, not seasonally adjusted, valued at end-period market prices. The Bank’s own monthly reserves workbook labels its gold row as including gold swapped or on loan; for June 2026 its dollar value matched the Database’s.
- The tonnes are an estimate: each month’s dollar value divided by the month-end gold price (GC=F). The sentence states the median over the latest twelve months, rounded to ten tonnes. Single months can differ by a few percent, so small wiggles in the Gold view are not purchases or sales: the Bank’s valuation price is not our benchmark.
August 2026: $45.7 billion, £33.7 billion at the month-end rate; an estimated 310 tonnes of gold, worked out from the dollar value. Bank of England Database series PQMBAAE, from February 1996.
Bank of England DatabaseWhat a shopping basket costs
A basket that cost £100 in January 2010 costs £164 in September 2026: US$220, or 1.6 grams of gold, against 4.5 grams then.
Actual amounts: pounds on the left axis, grams of gold on the right.
September 2026
- Basket · pounds£164.12
- Basket · grams of gold1.57 g
Show as table
What you see
The chart shows what the same basket costs in pounds, in US dollars and in grams of gold, each month at its own average rate and gold price. Combined puts pounds on the left axis and gold on the right.
What it means
Prices rose in pounds, but the pound bought more gold in some years and far less in others. The gold line shows how many grams the basket costs, not the weight of a specified basket of goods.
About the consumer-price comparison
- The Consumer Prices Index (ONS series D7BT, all items, 2015 = 100) is not seasonally adjusted. The basket is the index rebased to £100 in January 2010. Scanner data entered the index in March 2026 for about half of the grocery market; the ONS states the effect as small and names no break in the series.
- Each month uses its own average dollars per pound and pounds per gram of gold (GC=F × GBP=X); a month without a complete set of daily rates has no gold or dollar figure, and no other month stands in for it.
September 2026: £164.12, US$220.20, 1.57 g. Index 2015 = 100, not seasonally adjusted.
ONS consumer pricesWhat household deposits can buy
Households’ and non-profit institutions’ sterling deposits were £2,051 billion in August 2026 (US$2,777 billion), which could buy 19,273 tonnes of gold at the month-end price.
Actual amounts: pounds on the left axis, tonnes of gold buying power on the right.
August 2026
- Deposits · billion GBP£2,050.8bn
- Gold buying power · tonnes19,273 t
Show as table
What you see
The chart shows the deposits in pounds, in US dollars and as the tonnes of gold they could buy at each month-end close. Combined puts pounds on the left axis and gold on the right.
What it means
More pounds in accounts do not always mean more purchasing power. The gold line shows what the deposits could buy, not gold that households own; the figures are aggregate stocks, not a typical household’s balance.
Which deposits are included?
- Bank of England series LPMVWLM (sterling deposits from households) plus LPMVWLO (from non-profit institutions serving households) at UK-resident banks and building societies, monthly stocks in millions of pounds, not seasonally adjusted. The page shows their sum, as the US page combines households and nonprofit organizations.
- The US dollar value uses the month-end pound rate and the gold buying power the month-end gold price in pounds (the last close within seven days); a month without such a close has no figure of that kind.
August 2026: £2,050.8 billion, US$2,776.9 billion, 19,273 t of gold buying power. Bank of England Database, from September 1997.
Bank of England DatabaseThe pound against the dollar and gold
£100 bought US$175 and 13.3 grams of gold in December 2003; in September 2026 it buys US$134 and 1.0 grams.
Actual amounts: US dollars on the left axis, grams of gold on the right.
September 2026
- US dollars for £100$134.16
- Grams of gold for £1000.96 g
Show as table
What you see
The chart shows how many US dollars and how many grams of gold £100 bought each month, at the month’s average rates. Combined puts dollars on the left axis and gold on the right.
What it means
The number of pounds stays the same while what they buy changes. This is a way to read the pound’s purchasing power, not an index or an investment return.
September 2026: £100 buys US$134.16 and 0.96 g. Monthly averages of GBP=X and GC=F, not a retail quote.
The British pound and goldQuestions about the United Kingdom in gold
Can UK house prices rise in pounds and fall in gold?
A home can cost more pounds and less gold at once. The changes in the sentence come from the UK House Price Index, so they equal the map of regions and local authorities below; the levels are the published average prices, so the ratio of two levels can differ slightly from the stated change. In Q2 2026 the average UK home cost £271,292, US$364,200 or 2.5 kg of gold; against a year earlier that is −24.8 % in gold, +3.5 % in dollars and +2.9 % in pounds.
Why does the value of the UK government’s gold change, and how many tonnes is it?
A rising value can describe the same gold at a higher price rather than a larger reserve. The government owns the gold through the Exchange Equalisation Account, which HM Treasury oversees; the Bank of England manages it as its agent and keeps the gold in its vault. In August 2026 the UK government’s gold was worth $45.7 billion (£33.7 billion), +33.1 % against a year earlier in dollars. That is an estimated 310 tonnes of gold, worked out from the dollar value.
Why can everyday prices rise in pounds but fall in gold?
Prices rose in pounds, but the pound bought more gold in some years and far less in others. The gold line shows how many grams the basket costs, not the weight of a specified basket of goods. A basket that cost £100 in January 2010 costs £164 in September 2026: US$220, or 1.6 grams of gold, against 4.5 grams then.
Do the deposit figures mean households own that much gold?
More pounds in accounts do not always mean more purchasing power. The gold line shows what the deposits could buy, not gold that households own; the figures are aggregate stocks, not a typical household’s balance. Households’ and non-profit institutions’ sterling deposits were £2,051 billion in August 2026 (US$2,777 billion), which could buy 19,273 tonnes of gold at the month-end price.
What does the gold buying power of £100 mean?
The number of pounds stays the same while what they buy changes. This is a way to read the pound’s purchasing power, not an index or an investment return. £100 bought US$175 and 13.3 grams of gold in December 2003; in September 2026 it buys US$134 and 1.0 grams.
Source and method
The Bank of England publishes the government gold and household deposit series in its statistical Database, the Office for National Statistics the Consumer Prices Index, and HM Land Registry with the ONS, Registers of Scotland and LPS Northern Ireland the UK House Price Index. The providers supply the data only; the conversions into pounds, US dollars and gold, and every derived figure, are Gold Standard’s own. This page is not investment advice.
Each section carries its own observation date. Retained provider files were retrieved 2026-10-24; the series are read from the providers once a day and fall back to them when a provider does not answer.
- The government’s gold
- The Bank of England Database series PQMBAAE gives the market value of the central government’s gold in US dollar millions at each month end, not seasonally adjusted, at end-period market prices; the Bank’s monthly reserves workbook labels its gold row as including gold swapped or on loan, and its June 2026 dollar value matched the Database’s. The pound value uses the month-end pound rate (the last close within seven days).
- Ownership and tonnes
- The government owns the gold through the Exchange Equalisation Account, which HM Treasury oversees; the Bank of England manages it as its agent and keeps it in its vault. The tonnes in the Gold view and in the text are an estimate worked out from the dollar value and the gold price, not a published holding.
- The shopping basket
- The ONS Consumer Prices Index, series D7BT (all items, 2015 = 100, monthly, not seasonally adjusted), rebased to a basket that cost £100 in January 2010. Each month is converted at its own average dollars per pound and pounds per gram of gold (GC=F × GBP=X). Scanner data entered the index in March 2026 for about half of the grocery market; the ONS names no break in the series.
- Household deposits
- Sterling deposits of households together with non-profit institutions serving households at UK-resident banks and building societies (Bank of England series LPMVWLM and LPMVWLO, monthly stocks in millions of pounds, not seasonally adjusted), summed. These are aggregate balances, not a typical household’s savings; the gold line shows what the deposits could buy, not gold that households own.
- House prices
- The UK House Price Index’s average price (hedonic and mix-adjusted, not seasonally adjusted), each quarter the mean of its three monthly values, converted at the quarter’s own average rate and gold price. The changes come from the index and equal the housing map’s; the levels are the published average prices.
- The pound
- What £100 bought each month in US dollars and in grams of gold, at the month’s average of GBP=X and GC=F. The dollar value of a stock uses the pound rate, and its gold value the gold price in pounds, at the period end. It is no index and no investment return, and no retail quote.
Contains HM Land Registry data © Crown copyright and database right 2026. This data is licensed under the Open Government Licence v3.0.
Contains public sector information licensed under the Open Government Licence v3.0 (Bank of England). Source: Office for National Statistics licensed under the Open Government Licence v.3.0.