United States in gold
What gold reserves, everyday prices, savings and homes look like when measured in gold instead of dollars.
In short
Change against one year earlier
US gold reserve
8,134tonnes
September 2026In gold +0.0 %In dollars +8.1 %Consumer prices in dollars
+3.7 %
in one year
September 2026In gold −11.6 %Cash and deposits in gold
114,466
tonnes of buying power
Q2 2026In dollars +2.9 %In gold −15.7 %House prices in gold
−25.8 %
in one year
Q2 2026In dollars +2.1 %Gold bought by $100
0.71grams
September 2026In one year −14.8 %
The United States’ gold reserve
The Treasury holds 8,134 tonnes of gold, virtually unchanged since January 2012; its dollar market value is 140.9% higher than in January 2012.
September 2026
- In US dollars240.9
- In gold100.0
Show as table
What you see
The blue line shows what the reserve is worth at the market gold price; the gold line shows its physical weight. Compared starts both at 100. Switch to Dollars or Gold to read the actual amounts.
What it means
A rising dollar value can describe the same gold, rather than an increase in the reserve. The almost flat gold line reflects a stock that has changed very little. This gold belongs to the Treasury; the Federal Reserve holds part of it in custody.
September 2026: 8,133.5 tonnes. September 2026: $1,094.8 billion at the month-end market close. Treasury facility totals; statutory book value is not used.
Treasury gold reserve recordsWhat a shopping basket costs
A basket that cost $100 in September 2000 costs $194 in September 2026, but needs 87.9% less gold.
October 2025 CPI was not published; that observation and any comparison requiring it remain unavailable.
September 2026
- In US dollars194.0
- In gold12.1
Show as table
What you see
The same consumer basket is priced in dollars and in gold, with both lines starting at an index of 100 in Compared. The gold cost uses the average market price during each complete month. Gold shows relative cost, not the weight of a specified physical basket.
What it means
When the dollar line rises but the gold line falls, everyday goods have become dearer in dollars while costing less gold. That is the difference between dollar inflation and purchasing power measured in gold. Your own spending basket can develop differently.
About the consumer-price comparison
- CPI-U covers urban consumers and is not seasonally adjusted. Gold comparisons require a complete matching month.
September 2026: CPI-U 336.940, not seasonally adjusted. Gold comparison through September 2026.
BLS consumer prices through FREDWhat household cash and deposits can buy
Household cash and deposits are worth 345.4% more in dollars than in Q3 2000, but buy 69.8% less gold in Q2 2026.
Q2 2026
- In US dollars445.4
- In gold30.2
Show as table
What you see
The blue line tracks cash, checking, time and savings deposits held by households and nonprofit organizations. The gold line shows how much gold those same dollars could buy at each quarter-end market close. Compared starts both at 100; Dollars and Gold show the actual amounts.
What it means
More dollars in an account do not always mean more purchasing power. If the gold line falls while dollar balances rise, those balances buy less gold. This is a way to measure the money, not a claim that households own that gold.
Which balances are included?
- The Fed reports households and nonprofit organizations together. Cash/checking and time/savings are combined here; these are aggregate balances, not a typical family’s savings or its full asset portfolio.
- The 2025-Q4 reclassification moved balances between time/savings and checking. Adding both categories avoids interpreting that move as a shift into gold or foreign currency.
Q2 2026: $14.86 trillion, quarter-end stocks, not seasonally adjusted. Q2 2026: 114,466 tonnes of gold buying power at the quarter-end market close. Fed Z.1, FL153020005 and FL153030005.
Fed household balance-sheet dataHouse prices
In Q2 2026, a home costs 2.1% more dollars than a year earlier and 25.8% less gold, according to the national house-price index.
Q2 2026
- In US dollars303.6
- In gold17.6
Show as table
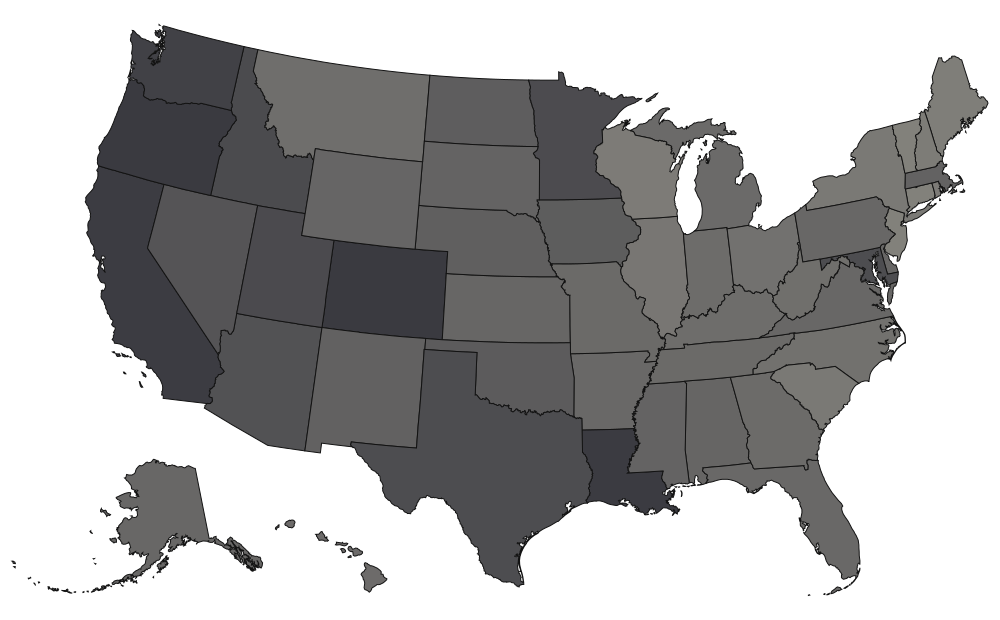
From Q2 2021 to Q2 2026, 0 of 51 areas with a figure got more expensive in gold and 51 cheaper.
Gold shows a rise, graphite a fall, and the hatched states have no figure for this period.
Explore the map of house prices by stateWhat you see
The same national house-price index is shown in dollars and in gold. Both lines start at 100 at the left edge of the selected range. A rising line means homes became more expensive in that unit; a falling line means they became cheaper.
What it means
A home can rise in dollars and still cost less gold. The gold line separates house-price development from the dollar’s changing value against gold. The state map below shows where the experience differs across the country.
Which homes does the index cover?
- FHFA Purchase-Only tracks repeat sales of eligible mortgage-financed single-family homes. It does not give a typical home’s dollar price.
- The national index is published separately; it is not an average of the state indices. Gold uses the matching complete-quarter benchmark.
Q2 2026: FHFA national Purchase-Only index, not seasonally adjusted; gold comparisons from Q1 2001.
Explore house prices in all 50 states and D.C.The dollar against gold
$100 bought 11.38 grams of gold in September 2000; in September 2026, the same $100 buys 0.71 grams.
September 2026
- Gold bought by $1000.71 g
Show as table
What you see
The line shows how much gold a fixed $100 can buy, using each complete month’s average gold price. A lower line means that the same dollars buy less gold. Switch to Dollars per gram to see the familiar gold-price quotation.
What it means
The number of dollars stays the same, but what those dollars can buy changes. This gives another view of the dollar’s purchasing power, beyond the price of a particular basket or home.
September 2026: $100 buys 0.71 grams; $140.35 per gram. GC=F futures benchmark, not a retail bullion quote.
The dollar and goldQuestions about the United States in gold
Why does the US gold reserve look almost unchanged?
A rising dollar value can describe the same gold, rather than an increase in the reserve. The almost flat gold line reflects a stock that has changed very little. This gold belongs to the Treasury; the Federal Reserve holds part of it in custody. The Treasury holds 8,134 tonnes of gold, virtually unchanged since January 2012; its dollar market value is 140.9% higher than in January 2012.
Why can everyday prices rise in dollars but fall in gold?
When the dollar line rises but the gold line falls, everyday goods have become dearer in dollars while costing less gold. That is the difference between dollar inflation and purchasing power measured in gold. Your own spending basket can develop differently. A basket that cost $100 in September 2000 costs $194 in September 2026, but needs 87.9% less gold.
Do the deposit figures mean households own that much gold?
More dollars in an account do not always mean more purchasing power. If the gold line falls while dollar balances rise, those balances buy less gold. This is a way to measure the money, not a claim that households own that gold. Household cash and deposits are worth 345.4% more in dollars than in Q3 2000, but buy 69.8% less gold in Q2 2026.
Can house prices rise in dollars and fall in gold?
A home can rise in dollars and still cost less gold. The gold line separates house-price development from the dollar’s changing value against gold. The state map below shows where the experience differs across the country. In Q2 2026, a home costs 2.1% more dollars than a year earlier and 25.8% less gold, according to the national house-price index.
What does the gold buying power of $100 mean?
The number of dollars stays the same, but what those dollars can buy changes. This gives another view of the dollar’s purchasing power, beyond the price of a particular basket or home. $100 bought 11.38 grams of gold in September 2000; in September 2026, the same $100 buys 0.71 grams.
Source and method
The Federal Reserve publishes household financial accounts. The Bureau of Labor Statistics publishes consumer prices, and FHFA publishes the housing indices. FRED distributes these agencies’ series; their original sources and seasonal adjustment remain identified by subject.
The physical gold reserve belongs to the US Treasury. Treasury’s statutory book value is not a market valuation. This page compares the recorded gold weight with its value at the month-end market close. The market value uses the site’s GC=F benchmark, not the statutory book price.
Cash and deposit figures cover households and nonprofit organizations. They are aggregate balance-sheet stocks; they do not reveal a typical family’s account balance, foreign-currency exposure or holdings of gold. The same dollar total is divided by the last market gold close at quarter end to show its gold buying power. A close more than seven days old cannot supply that comparison.
The consumer-basket comparison is an index, using the average GC=F gold benchmark of the same complete month. It does not assign a gram price to an unspecified basket. The dollar/gold subject shows the grams that a fixed $100 can buy. The benchmark is not a retail bullion quote.
Each section carries its own observation date. Retained Treasury and FRED snapshots were retrieved 2026-10-16; the daily gold fallback was retrieved 2026-10-16. Available live provider observations can be newer. Missing observations remain unavailable.