Singapore in gold
What MAS gold reserves, everyday prices, household savings and HDB homes look like when measured in gold instead of Singapore dollars.
In short
Change against one year earlier
MAS gold reserve
203.4tonnes
August 2026In gold −0.4 %Book value in dollars +17.2 %Consumer prices in Singapore dollars
+2.3 %
in one year
August 2026In gold −21.1 %In US dollars +3.0 %Household deposits in gold
4,257.0
tonnes of buying power
Q2 2026In Singapore dollars +5.0 %In gold −15.1 %House prices in gold
−19.5 %
in one year
Q3 2026In Singapore dollars −1.1 %In US dollars −0.9 %Gold bought by S$100
0.58grams
October 2026In one year −1.2 %
The Monetary Authority of Singapore's gold
The Monetary Authority of Singapore held 203.4 tonnes of gold in August 2026, 0.4% less than the 204.1 tonnes held in August 2025; its reported gold book value was 1.35 percent of official reserve assets.
Actual amounts. Right axis: tonnes of gold. Left axis: billion USD. Blue: reported book value; aqua: estimated market value. Separate units and fixed axis ranges; line heights are not directly comparable.
August 2026
- Book value · billion USD$5.8bn
- Estimated market value · billion USD$29.3bn
- Gold · tonnes203.4 t
Show as table
What you see
The gold line shows the physical holdings in tonnes on the right axis. The blue line shows the MAS-reported book value in billions of US dollars on the left axis. The aqua line shows the estimated market value: that month's gold holdings multiplied by the last available gold close at month-end, no more than seven days earlier. All views show actual amounts and keep their axis ranges fixed.
What it means
The reported book value does not track the current gold market price. The estimated market value changes with both the gold holdings and the gold price. The reserve share still compares the reported gold book value with official reserve assets of the same month.
August 2026: 203.4 tonnes. US$5.83 billion at the reported book value. US$29.31 billion estimated market value at the month-end gold close. 1.35 percent of US$433.0 billion official reserve assets. Source: IMF IRFCL; MAS monthly report for the exact fine troy ounces. Market valuation calculated by Gold Standard.
MAS reserve assets and goldWhat a shopping basket costs
A basket that cost S$100 in January 2010 cost S$140.37 in August 2026, US$109.95, or 0.77 grams of gold.
Actual basket cost. Right axis: grams of gold. Left axis: SGD / USD. Separate units and fixed axis ranges; line heights are not directly comparable.
August 2026
- Basket cost · SGDS$140.37
- Basket cost · USD$109.95
- Basket cost · grams of gold0.77 g
Show as table
What you see
The lines show the actual cost of the same basket. Grams of gold use the right axis; Singapore dollars and US dollars use the left axis. Each month uses its average exchange rate and gold price; the January 2010 basket cost S$100. Both axis ranges stay fixed when the view or time range changes. Before September 2000 the gold price is the World Bank monthly mean in US dollars per ounce, converted at the month's average exchange rate.
What it means
When the Singapore-dollar line rises but the gold line falls, everyday goods cost more dollars but less gold. That is the difference between consumer-price inflation and purchasing power measured in gold.
August 2026: CPI All Items 103.334 (2024 = 100), not seasonally adjusted. Basket cost: S$140.37, US$109.95, 0.77 g of gold.
SingStat consumer pricesWhat household cash and deposits can buy
Households held S$714.2 billion in currency and deposits at the end of Q2 2026, worth US$552.7 billion at the quarter-end rate, and 4,257.0 tonnes of gold buying power at the quarter-end close.
Actual amounts. Right axis: tonnes of gold buying power. Left axis: billions of SGD / USD. Separate units and fixed axis ranges; line heights are not directly comparable.
Q2 2026
- Deposits · billion SGDS$714.2bn
- Deposits · billion USD$552.7bn
- Gold buying power · tonnes4,257.0 t
Show as table
What you see
The lines show actual amounts at the quarter end. Tonnes of gold buying power use the right axis; billions of Singapore dollars and US dollars use the left axis. Both axis ranges stay fixed when the view or time range changes. CPF balances are not included. For the quarters before the third quarter of 2000 the gold price at the quarter end is approximated by the World Bank monthly mean of the quarter's last month. Against observed quarter-end closes since 2000 that mean differs by about 1.7 percent at the median, 4.5 percent at the 90th percentile and at most about 9.7 percent.
What it means
More dollars in an account do not always mean more purchasing power. If the gold line falls while the Singapore-dollar line rises, those deposits buy less gold. This is an aggregate stock, not a typical household's balance or gold ownership.
Q2 2026: S$714.2 billion, quarter-end stock, not seasonally adjusted. US$552.7 billion at the quarter-end rate. 4,257.0 tonnes of gold buying power at the quarter-end close. CPF balances are separate and not included.
SingStat household sectorHouse prices
In Q3 2026, the national median four-room resale price was S$6,547 per square metre, US$5,113, or 37.0 grams of gold; it cost 19.5% less gold than a year earlier.
Actual median price per m². Right axis: grams of gold per m². Left axis: SGD / USD per m². Separate units and fixed axis ranges; line heights are not directly comparable.
Q3 2026
- Median price · SGD per m²S$6,547
- Median price · USD per m²$5,113
- Median price · grams of gold per m²37.0 g
Show as table
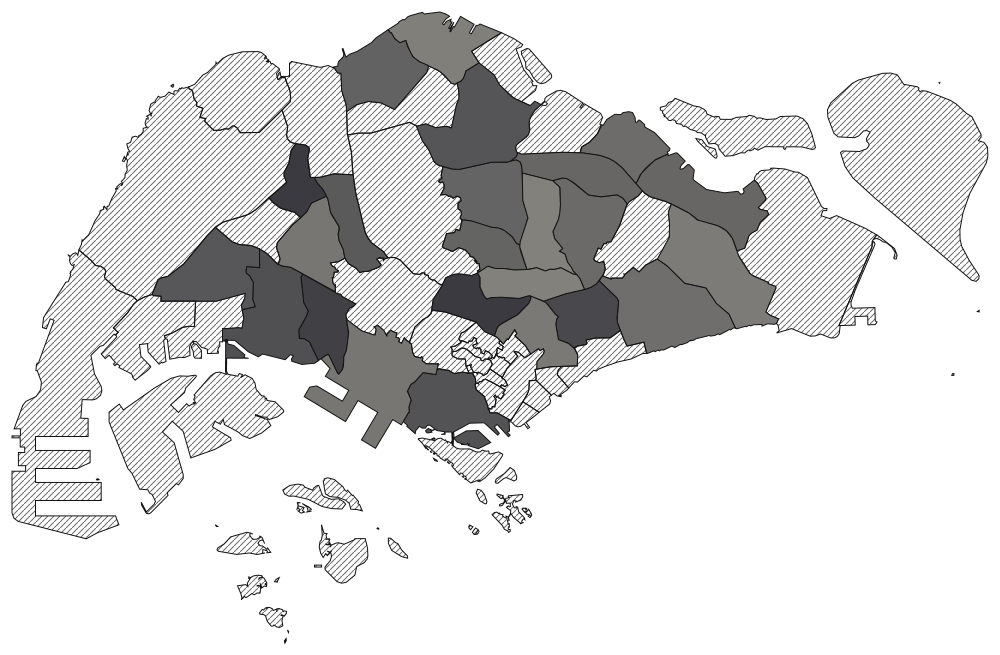
From Q3 2021 to Q3 2026, 0 of 24 planning areas with a figure got more expensive in gold and 24 cheaper.
Gold shows a rise, graphite a fall, and the hatched planning areas have no figure for this period.
Explore the map of house prices by planning areaWhat you see
The lines show the actual national median four-room resale price per square metre. Conversions use the quarter-average exchange rate and gold price. Grams of gold use the right axis; Singapore dollars and US dollars use the left axis. Both axis ranges stay fixed when the view or time range changes. The map below shows the 55 planning areas.
What it means
A home can rise in Singapore dollars and still cost less gold. The gold line separates house-price development from the changing value of the Singapore dollar against gold. The figures are Gold Standard's medians from HDB records, not an HDB-published index.
What the figures cover
- Only four-room HDB resale flats in registered transactions from March 2012 onwards.
- A planning area and quarter needs at least 20 transactions; HDB's recorded floor area is approximate.
- The national series is the median of all matched four-room transactions, not an average of planning-area medians.
Q3 2026: S$6,547 per m², US$5,113, 37.0 g of gold. Derived from HDB registration-date transactions; not an HDB index.
Explore house prices by planning areaThe Singapore dollar against the US dollar and gold
S$100 bought US$78.13 or 0.58 grams of gold in October 2026.
Buying power of S$100. Right axis: grams of gold. Left axis: US dollars. Separate units and fixed ranges; line heights are not directly comparable.
October 2026
- US dollars bought by S$100$78.13
- Grams of gold bought by S$1000.58 g
Show as table
What you see
The lines show what S$100 can buy: US dollars on the left axis and grams of gold on the right. Values use the available daily closes averaged within each month. Both axes keep fixed ranges when the view or time range changes. Before September 2000 the gold price is the World Bank monthly mean in US dollars per ounce, converted at the month's average exchange rate.
What it means
A falling gold line means S$100 buys less gold. A falling dollar line means it buys fewer US dollars. This is buying power, not a return on an investment or an amount of gold held by households.
October 2026: S$1.28 per US$; S$171.50 per gram of gold; S$100 buys 0.58 grams. GC=F and SGD=X benchmarks, not retail bullion quotes.
The Singapore dollar and goldQuestions about Singapore in gold
How much gold does Singapore hold, and what share of its reserves is it?
The reported book value does not track the current gold market price. The estimated market value changes with both the gold holdings and the gold price. The reserve share still compares the reported gold book value with official reserve assets of the same month. The Monetary Authority of Singapore held 203.4 tonnes of gold in August 2026, 0.4% less than the 204.1 tonnes held in August 2025; its reported gold book value was 1.35 percent of official reserve assets.
Why can everyday prices rise in Singapore dollars but fall in gold?
When the Singapore-dollar line rises but the gold line falls, everyday goods cost more dollars but less gold. That is the difference between consumer-price inflation and purchasing power measured in gold. A basket that cost S$100 in January 2010 cost S$140.37 in August 2026, US$109.95, or 0.77 grams of gold.
Do the household deposit figures mean households own that much gold?
More dollars in an account do not always mean more purchasing power. If the gold line falls while the Singapore-dollar line rises, those deposits buy less gold. This is an aggregate stock, not a typical household's balance or gold ownership. Households held S$714.2 billion in currency and deposits at the end of Q2 2026, worth US$552.7 billion at the quarter-end rate, and 4,257.0 tonnes of gold buying power at the quarter-end close.
Can HDB prices rise in Singapore dollars and fall in gold?
A home can rise in Singapore dollars and still cost less gold. The gold line separates house-price development from the changing value of the Singapore dollar against gold. The figures are Gold Standard's medians from HDB records, not an HDB-published index. In Q3 2026, the national median four-room resale price was S$6,547 per square metre, US$5,113, or 37.0 grams of gold; it cost 19.5% less gold than a year earlier.
What does the Singapore dollar buy in gold?
A falling gold line means S$100 buys less gold. A falling dollar line means it buys fewer US dollars. This is buying power, not a return on an investment or an amount of gold held by households. S$100 bought US$78.13 or 0.58 grams of gold in October 2026.
Source and method
Conversions into US dollars and gold are Gold Standard's own and are not investment advice. Each subject names its source and date, and missing observations remain unavailable.
Monthly figures and house prices are converted with the average price of their own period; stocks, such as household deposits, with the last close at quarter end.
- Gold reserve
- The Monetary Authority of Singapore publishes its official reserve assets through the IMF's IRFCL template. The monthly series is the IMF re-dissemination, rounded to the nearest thousand fine troy ounces; the latest MAS monthly report is the exact primary figure. The IMF attribution is required, and the site records the commercial-reuse permission in its data notes before release.
- Book value and market value
- The blue dollar series is MAS's reported book value, converted at month-end exchange rates; the reserve share uses that basis. The aqua series is Gold Standard's estimate: monthly fine troy ounces multiplied by the last available month-end USD gold close, no more than seven days earlier. Missing prices are left unavailable.
- Prices and the basket
- The Singapore Department of Statistics publishes the consumer-price index, All Items, for general households (2024 = 100, not seasonally adjusted). The shopping basket is priced from a January 2010 cost of S$100, using monthly average exchange rates and gold prices; its gold cost is shown in grams.
- Household deposits
- From the household sector balance sheet: currency and deposits. CPF balances are a separate household asset and are not included. It is an aggregate stock, not a typical household's balance, and the gold line is buying power, not gold ownership, shown in tonnes.
- House prices
- HDB publishes registered resale transactions. The figures are Gold Standard's own medians of four-room flats' price per square metre, from March 2012 onwards; they are not an HDB-published index. The planning-area boundaries are the URA Master Plan 2019 boundary; block coordinates come from OneMap/SLA. The shapes were simplified.
- Exchange rates and gold prices
- SGD/USD before December 2003 is the Federal Reserve's daily DEXSIUS series, from January 1981; from December 2003 it is Yahoo Finance's SGD=X. Gold is Yahoo's GC=F futures history, which starts in August 2000; the basket, S$100 and household gold lines reach further back (see Gold before 2000). A period without enough gold prices stays unavailable. Saved daily observations preserve the history when a feed fails.
- Gold before 2000
- Before September 2000 the gold price comes from the World Bank Commodity Price Data (The Pink Sheet), licensed under CC BY 4.0 (World Bank terms of use). The World Bank Group authorizes the use of this material subject to the terms and conditions on its website.
- Chart data
- Download chart data (JSON) for the observation dates, units, sources and unrounded values. Dollar amounts use the left axis and gold quantities the right; their line heights are not a ratio.
Source: International Monetary Fund, International Reserves and Foreign Currency Liquidity (IRFCL), data.imf.org.
SingStat data and the URA boundaries are used under the Singapore Open Data Licence.
Gold Standard converted these values: each monthly mean in US dollars per troy ounce is multiplied by that month's average SGD per USD rate and shown in Singapore dollars or grams of gold. The World Bank does not endorse this site, its charts or its conclusions. Before June 2025 the series is the London afternoon fixing, averaged daily; from June 2025 it is the spot average of daily rates. It is not published or endorsed by LBMA or ICE Benchmark Administration. The World Bank publishes the monthly values rounded to whole US dollars. These monthly means are used only for the shopping-basket and S$100 gold lines and, as a stated approximation of the quarter-end close, for the household gold buying power before the third quarter of 2000; Yahoo's GC=F history replaces them from September 2000.