Netherlands in gold
What De Nederlandsche Bank’s gold, everyday prices, household deposits, homes and the euro look like when measured in gold as well as in euros.
In short
Change against one year earlier
House prices in gold
−17.2 %
in one year
Q3 2026In dollars +1.7 %In euros +3.3 %De Nederlandsche Bank gold
€73.1bn
market value
September 2026In euros +11.7 %In dollars +7.8 %A €100 basket in gold
1.3
grams of gold
September 2026In gold −13.3 %In euros +3.4 %Deposits in gold
5,671
tonnes of buying power
September 2026In gold −5.6 %In euros +5.4 %Gold bought by €100
0.85grams
October 2026In gold −4.8 %In dollars −3.7 %
House prices by province, in gold
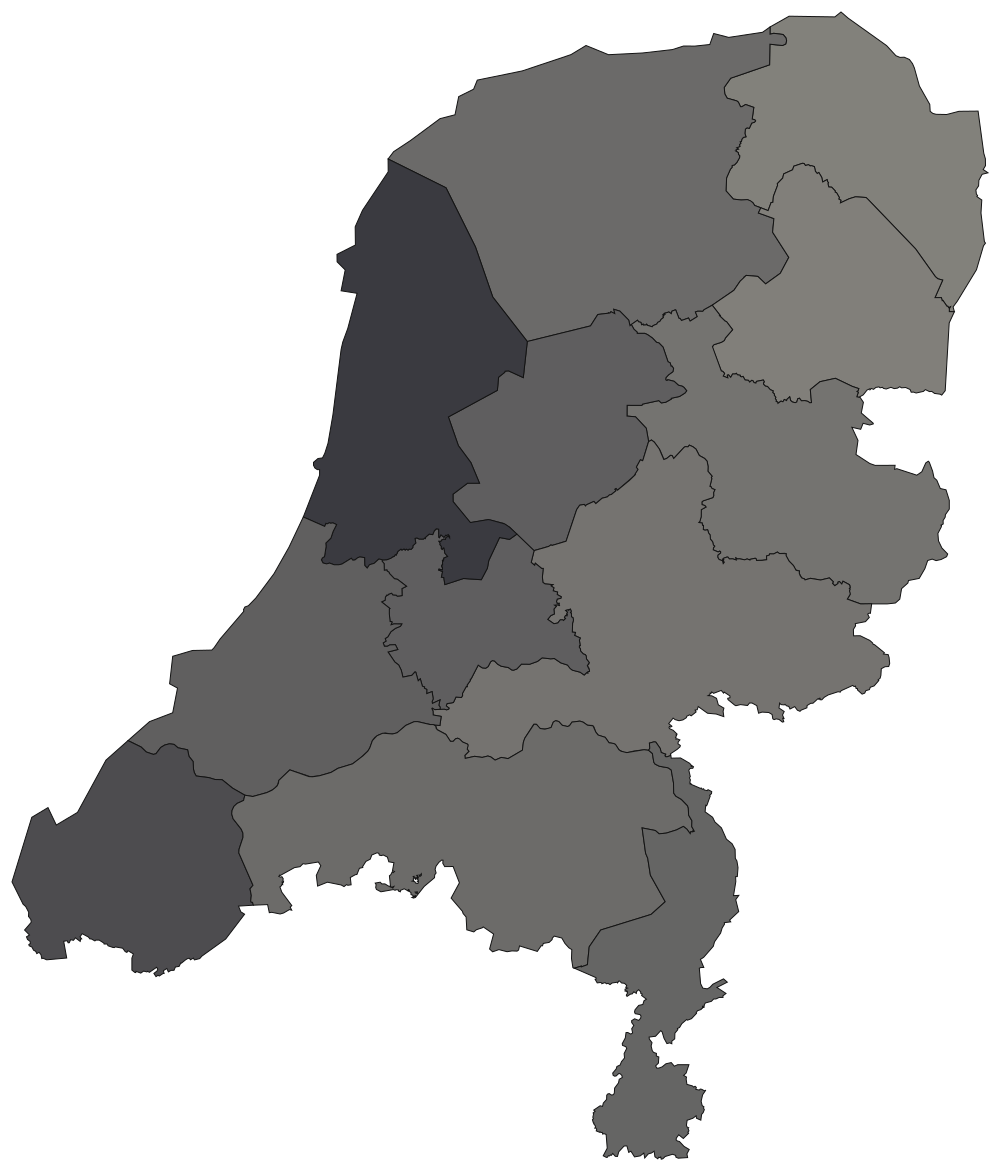
From Q3 2021 to Q3 2026, none of the 12 provinces with a figure got more expensive in gold and all 12 got cheaper.
Gold shows a rise, graphite a fall, and a hatched area has no figure for this period.
Explore the map of house prices by provinceHouse prices
In Q3 2026 the average existing home in the Netherlands sold for €502,982, US$578,700 or 4.2 kg of gold, against 5.1 kg of gold in Q3 2025. CBS’s price index (2020 = 100) stood at 156.4; over one year, Q3 2026 against Q3 2025, +3.3 % in euros, +1.7 % in US dollars and −17.2 % in gold.
CBS’s price index in euros, in US dollars and in gold. Each line starts at 100 at the left edge.
Q3 2026
- Euros227.3
- US dollars209.3
- Gold19.9
Show as table
What you see
The chart shows the average home in euros, in US dollars and in kilograms of gold, each quarter at its own average rate and gold price. Compared shows CBS’s price index in the three units, each line starting at 100.
What it means
A home can cost more euros and less gold at once. The one-year changes come from the index, as on the map of the provinces above.
What do the average and the index measure?
- The average home is CBS’s mean sale price of the existing homes sold in the quarter (table 85792NED, in euros). The average depends on which homes were sold, and CBS publishes no price per square metre. It can move differently from the price development the index measures.
- CBS and the Kadaster compute the index (2020 = 100) from registered sales and the municipal property values (WOZ); it adjusts for which homes were sold. This is the national series; the map above shows the 12 provinces. Both start in 2004 Q1, the first quarter with a gold price and a dollar rate, and each quarter is converted at its own average.
Q3 2026: average home €502,982, US$578,700, 4.2 kg of gold; index 156.4 (2020 = 100); over one year, Q3 2026 against Q3 2025, +3.3 % in euros, +1.7 % in US dollars and −17.2 % in gold. CBS, table 85792NED, quarterly.
Explore house prices by provinceDe Nederlandsche Bank’s gold
De Nederlandsche Bank holds 612.5 tonnes (19.691 million fine troy ounces) of gold, the same in every month of the IMF’s series since January 2016. In September 2026 it was worth €73.1 billion (US$82.7 billion), +11.7 % against a year earlier in euros.
Actual amounts: euros on the left axis, tonnes of gold on the right. The weight is the IMF’s published volume.
September 2026
- Market value · billion EUR€73.1bn
- Gold weight · tonnes612.5 t
Show as table
What you see
The chart shows the value of the bank’s gold at the end of each month, in euros or in US dollars, and its weight in tonnes. Combined puts euros on the left axis and the tonnes on the right. The weight is a flat line: the bank has not changed its volume.
What it means
The bank’s gold is a fixed weight, so its value rises and falls with the price of gold and the euro rate and not with purchases or sales. The weight is the IMF’s published volume; the value is that weight at the site’s month-end price.
About the gold figures
- The series are the IMF’s International Reserves and Foreign Currency Liquidity data for the Netherlands (sector: central bank): the volume of gold in fine troy ounces and the approximate market value in US dollars, monthly. The bank itself states 612.4 tonnes and €72.2 billion for the end of 2025; the figures here use the IMF’s ounces at the site’s own month-end price (GC=F and EUR=X), so they can differ slightly from the bank’s valuation.
- The IMF’s own dollar value is compared with these figures every time the snapshot is updated, and the update stops if they drift apart or if the published volume changes.
September 2026: €73.1 billion, US$82.7 billion at the month-end rate; 612.5 tonnes (19.691 million fine troy ounces). IMF IRFCL, sector S1X, monthly from January 2016.
IMF reserve and liquidity dataWhat a shopping basket costs
A basket that cost €100 in January 2010 costs €156 in September 2026: US$179, or 1.3 grams of gold, against 4.0 grams then.
Actual amounts: euros on the left axis, grams of gold on the right.
September 2026
- Basket · euros€155.96
- Basket · grams of gold1.28 g
Show as table
What you see
The chart shows what the same basket costs in euros, in US dollars and in grams of gold, each month at its own average rate and gold price. Combined puts euros on the left axis and gold on the right.
What it means
Prices rose in euros, but the euro bought more gold in some years and far less in others. The gold line shows how many grams the basket costs, not the weight of a specified basket of goods.
About the consumer-price comparison
- CBS’s consumer price index (table 86141NED, all expenditure, 2025 = 100) is monthly. The basket is the index rebased to €100 in January 2010. CBS moved the index to the base 2025 and discontinued the table with the base 2015; the page reads only the base-2025 table, which starts in December 2009, and never joins it to the old one. The update stops if the base changes again.
- Each month uses its own average dollars per euro and euros per gram of gold (GC=F × EUR=X); a month without a complete set of daily rates has no gold or dollar figure, and no other month stands in for it.
September 2026: €155.96, US$179.35, 1.28 g. CBS table 86141NED, CPI 2025 = 100.
CBS consumer pricesWhat household deposits can buy
Deposits of households and non-profit institutions in the Netherlands were €676 billion in September 2026 (US$766 billion), which could buy 5,671 tonnes of gold at the month-end price. The latest value is provisional and can be revised.
Actual amounts: euros on the left axis, tonnes of gold buying power on the right.
September 2026
- Deposits · billion EUR€676.4bn
- Gold buying power · tonnes5,671 t
Show as table
What you see
The chart shows the deposits in euros, in US dollars and as the tonnes of gold they could buy at each month-end close. Combined puts euros on the left axis and gold on the right.
What it means
More euros in accounts do not always mean more purchasing power. The gold line shows what the deposits could buy, not gold that households own; the figures are aggregate stocks, not a typical household’s balance.
Which deposits are included?
- The deposits are those of households and of non-profit institutions serving households with the monetary financial institutions in the Netherlands, in euros; the two sectors are published together and are not separated. European Central Bank, BSI series BSI.M.NL.N.A.L20.A.1.U2.2250.Z01.E, monthly stocks in euro millions; the latest month is provisional until the ECB confirms it.
- The US dollar value uses the month-end euro rate and the gold buying power the month-end gold price in euros (the last close within seven days); a month without such a close has no figure of that kind.
September 2026: €676.4 billion, US$766.2 billion, 5,671 t of gold buying power (provisional). ECB BSI, households and non-profit institutions, from January 2003.
ECB balance sheet items statisticsThe euro against the dollar and gold
€100 bought US$123 and 9.4 grams of gold in December 2003; in October 2026 it buys US$112 and 0.8 grams.
Actual amounts: US dollars on the left axis, grams of gold on the right.
October 2026
- US dollars for €100$112.08
- Grams of gold for €1000.85 g
Show as table
What you see
The chart shows how many US dollars and how many grams of gold €100 bought each month, at the month’s average rates. Combined puts dollars on the left axis and gold on the right.
What it means
The number of euros stays the same while what they buy changes. This is a way to read the euro’s purchasing power, not an index or an investment return.
October 2026: €100 buys US$112.08 and 0.85 g. Monthly averages of EUR=X and GC=F, apart from the euro page’s daily quote.
The euro and goldQuestions about the Netherlands in gold
Can Dutch house prices rise in euros and fall in gold?
A home can cost more euros and less gold at once. The one-year changes come from the index, as on the map of the provinces above. In Q3 2026 the average existing home in the Netherlands sold for €502,982, US$578,700 or 4.2 kg of gold, against 5.1 kg of gold in Q3 2025. CBS’s price index (2020 = 100) stood at 156.4; over one year, Q3 2026 against Q3 2025, +3.3 % in euros, +1.7 % in US dollars and −17.2 % in gold.
How much gold does De Nederlandsche Bank hold, and why does its value change?
The bank’s gold is a fixed weight, so its value rises and falls with the price of gold and the euro rate and not with purchases or sales. The weight is the IMF’s published volume; the value is that weight at the site’s month-end price. De Nederlandsche Bank holds 612.5 tonnes (19.691 million fine troy ounces) of gold, the same in every month of the IMF’s series since January 2016. In September 2026 it was worth €73.1 billion (US$82.7 billion), +11.7 % against a year earlier in euros.
Why can everyday prices rise in euros but fall in gold?
Prices rose in euros, but the euro bought more gold in some years and far less in others. The gold line shows how many grams the basket costs, not the weight of a specified basket of goods. A basket that cost €100 in January 2010 costs €156 in September 2026: US$179, or 1.3 grams of gold, against 4.0 grams then.
Do the deposit figures mean households own that much gold?
More euros in accounts do not always mean more purchasing power. The gold line shows what the deposits could buy, not gold that households own; the figures are aggregate stocks, not a typical household’s balance. Deposits of households and non-profit institutions in the Netherlands were €676 billion in September 2026 (US$766 billion), which could buy 5,671 tonnes of gold at the month-end price. The latest value is provisional and can be revised.
What does the gold buying power of €100 mean?
The number of euros stays the same while what they buy changes. This is a way to read the euro’s purchasing power, not an index or an investment return. €100 bought US$123 and 9.4 grams of gold in December 2003; in October 2026 it buys US$112 and 0.8 grams.
Source and method
The International Monetary Fund publishes the gold of De Nederlandsche Bank, Statistics Netherlands (CBS) the consumer price index and the house price index, the European Central Bank the deposits of households, and the Kadaster the province boundaries. The providers supply the data only and do not endorse this page; the conversions into euros, US dollars and gold, and every derived figure, are Gold Standard’s own. This page is not investment advice.
Each section carries its own observation date. Retained provider files were retrieved 2026-11-04; the series are read from the providers once a day and fall back to them when a provider does not answer.
- The bank’s gold
- The IMF’s International Reserves and Foreign Currency Liquidity data for the Netherlands, sector central bank: the gold volume in fine troy ounces, monthly, 19,691,000 (612.5 tonnes) in every month since January 2016; the bank itself states 612.4 tonnes and €72.2 billion for the end of 2025. The value is the ounces at the site’s month-end gold price and euro rate; the IMF’s own dollar value is the cross-check, and the update stops if the volume changes.
- The shopping basket
- CBS’s consumer price index, all expenditure (table 86141NED, 2025 = 100, monthly), rebased to a basket that cost €100 in January 2010. The series is checked by its table, measure, category and base before it is read; the discontinued table with the base 2015 is never joined to it. Each month is converted at its own average dollars per euro and euros per gram of gold.
- Household deposits
- The deposits are those of households and of non-profit institutions serving households with the monetary financial institutions in the Netherlands, in euros; the two sectors are published together and are not separated. ECB series BSI.M.NL.N.A.L20.A.1.U2.2250.Z01.E, monthly stocks in euro millions; the latest month is provisional. The balances are aggregate, not a typical household’s savings, and the gold line is what they could buy, not gold households own.
- House prices
- CBS’s national price index of existing owner-occupied dwellings (table 85792NED, 2020 = 100, quarterly from 2004 Q1 in this page). It is an index of how prices changed, not a price: the page states no price in euros or per square metre. Each quarter is converted at the average gold price and dollar rate of that quarter, and the one-year changes compare exact quarters, as the housing map does.
- The euro
- What €100 bought each month in US dollars and grams of gold, at the month’s average of EUR=X and GC=F, the histories of the euro page. Stocks use the rate and the gold price at the period end. It is no index, no investment return and no retail quote.
Source: International Monetary Fund, International Reserves and Foreign Currency Liquidity (IRFCL), https://data.imf.org/en/datasets/IMF.STA:IRFCL.
Source: Statistics Netherlands (CBS), table 86141NED, consumer prices, CPI 2025 = 100 (CC BY 4.0), retrieved 2026-11-04.
Source: European Central Bank, BSI statistics, series BSI.M.NL.N.A.L20.A.1.U2.2250.Z01.E, retrieved 2026-11-04.
Source: Statistics Netherlands (CBS), table 85792NED, price index of existing owner-occupied dwellings (CC BY 4.0). Gold Standard converts CBS's index into gold and US dollars; the conversions are Gold Standard's, not CBS's.
Province boundaries: Kadaster, PDOK Bestuurlijke Gebieden, CC BY 4.0; shapes simplified.
The International Monetary Fund, Statistics Netherlands (CBS), the European Central Bank, De Nederlandsche Bank and the Kadaster supply the data only and do not endorse this page.