The Copper-to-Gold Ratio: A Powerful Economic Indicator
Discover how this fundamental relationship between industrial copper and precious gold offers profound insights into global economic trends, market sentiment, and treasury yield forecasting.

Ali Karadag
Software Architect & Entrepreneur
Key Insights
- The copper-to-gold ratio compares an industrial metal to a safe-haven asset, providing insights beyond traditional economic indicators
- A rising ratio signals economic expansion and risk appetite, while a falling ratio indicates uncertainty and potential economic slowdown
- The ratio has demonstrated a strong correlation with 10-year U.S. Treasury yields, as shown in our interactive data visualization using real Federal Reserve data
- Current data shows the ratio has fallen to 0.0015, approaching 2009 financial crisis lows, despite fundamentally different economic conditions
- Recent economic indicators including the Chicago Fed's National Activity Index suggest the US may be entering or within a recession
Introduction to the Copper-to-Gold Ratio
The copper-to-gold ratio is a fundamental economic indicator that compares the prices of two metals with vastly different roles in the global economy. This relationship offers powerful insights that can help investors navigate complex market dynamics and anticipate economic trends.
Key Takeaways
- The copper-to-gold ratio compares an industrial metal to a safe-haven asset, providing insights beyond traditional economic indicators
- A rising ratio signals economic expansion and risk appetite, while a falling ratio indicates uncertainty and potential economic slowdown
- The ratio has demonstrated a strong correlation with 10-year U.S. Treasury yields, as shown in our interactive data visualization using real Federal Reserve data
- Current data shows the ratio has fallen to 0.0015, approaching 2009 financial crisis lows, despite fundamentally different economic conditions
- Recent economic indicators including the Chicago Fed's National Activity Index suggest the US may be entering or within a recession
Understanding the Copper-to-Gold Ratio
The copper-to-gold ratio is calculated by dividing the price of copper by the price of gold. While some calculate it on an ounce-to-ounce basis, others may use different units (such as copper pounds to gold ounces). However, the absolute value of the ratio is not the primary focus – what truly matters is the direction of the ratio and its movements over time.
This ratio is uniquely valuable because it compares two metals with fundamentally different economic roles:
- Copper: Known informally as "Dr. Copper," this industrial metal is widely used in global manufacturing, construction, and electrical applications, making it highly sensitive to economic activity and growth. As an industrial workhorse, copper demand rises during periods of economic expansion.
- Gold: Recognized as the most prominent safe-haven asset, gold typically thrives during periods of economic uncertainty and serves as a store of value during turbulent times. Investors tend to flock to gold when seeking protection from market volatility or inflation.
Interpretation Guidelines
The ratio offers clear signals about economic conditions:
Rising Ratio
When copper strengthens relative to gold, this typically indicates economic expansion, risk appetite, industrial optimism, and a generally positive economic outlook. Investors are favoring growth over safety.
Falling Ratio
When gold strengthens relative to copper, this suggests economic uncertainty, risk aversion, slowing global growth, or inflationary concerns. Investors are prioritizing capital preservation over growth opportunities.
Historical Context
The ratio has been in existence for centuries, with its origins dating back to the ancient world. Copper and gold have been used as money and as a store of value, and their relative prices have always been a subject of interest.

Economic Significance
The copper-to-gold ratio functions as a multifaceted economic indicator with several key applications:
Leading Indicator for Treasury Yields
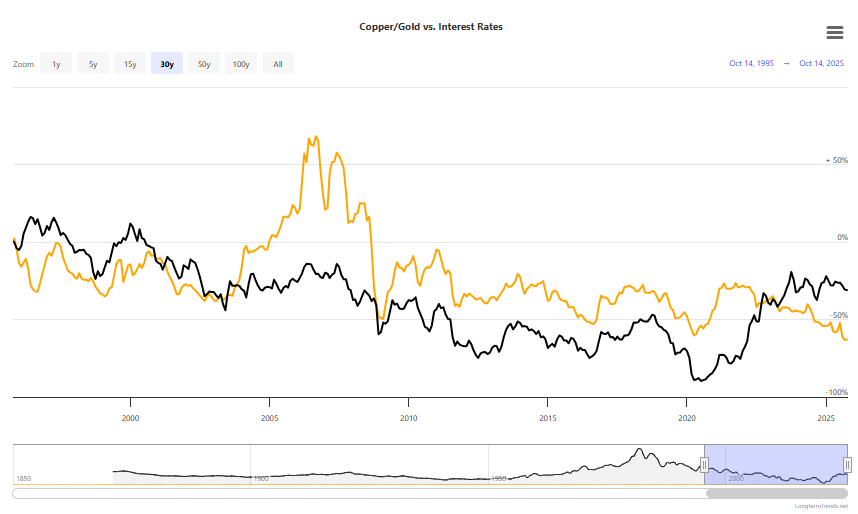
Research shows that the copper-to-gold ratio often serves as a leading indicator for 10-year U.S. Treasury yields. This relationship has been particularly noticeable in recent years during periods without major economic shocks.
Several studies including univariate and multivariate regressions, visual inspections, and correlation tests suggest that the copper-to-gold ratio embeds credible information about future movements in the 10-year U.S. Treasury yield. When the ratio rises, yields often follow suit, indicating economic expansion and potentially higher inflation expectations.
As the interactive chart above demonstrates, the copper-to-gold ratio and 10-year Treasury yields exhibit a strong positive correlation over most time periods. This real-time data visualization shows how closely these two metrics move together, with divergences often signaling potential market turning points.
The correlation is particularly notable because it connects a commodity price relationship (copper-to-gold) with a bond market indicator (Treasury yields), demonstrating how different asset classes respond to the same underlying economic forces. When the ratio rises (suggesting economic strength), bond yields typically increase as investors demand higher compensation for inflation risk. Conversely, when the ratio falls (indicating economic caution), yields often decrease as investors seek safety in government bonds.
Under current conditions, with the ratio falling to 0.0015, we would typically expect significantly lower Treasury yields. However, the relationship may be complicated by central bank policies and structural market factors that could distort the traditional correlation. The historical relationship suggests yields could fall further if the ratio remains at crisis levels, potentially supporting a view that interest rates are likely to "go down quite a bit and stay there."
Business Cycle Barometer
The ratio acts as a reliable barometer for measuring the relative strength of industrial activity against fears of economic recession or inflation. During economic expansion, copper prices typically increase faster than gold as industries invest and increase production, driving up the ratio.
Conversely, during economic uncertainty, gold outperforms copper as investors seek safe-haven assets. When there are expectations of an economic contraction, copper prices usually decline, while gold prices ascend. If gold's price increases at a faster rate than copper or falls at a slower pace, the ratio diminishes.
The current ratio of 0.0015, approaching levels seen during the 2009 financial crisis, clearly points to a business cycle in contraction territory. This dramatic signal appears particularly ominous when considered alongside the Chicago Fed's National Activity Index showing five consecutive months of negative readings through October 2025. The ratio's position suggests we may be in a late-stage contraction or entering a recessionary environment despite official data not yet confirming this status.
"The copper-to-gold ratio effectively captures the tension between industrial growth and economic caution, making it an elegant gauge of the business cycle."
— Ali Karadag, CEO Blackmill Solutions
Global Manufacturing Monitor
Given copper's extensive use in manufacturing and China's position as the world's largest consumer (accounting for approximately half of global demand), the ratio provides insights into global industrial activity. A rising ratio often signals robust manufacturing activity, particularly in copper-intensive economies.
Manufacturing sectors such as construction, electronics, and transportation all rely heavily on copper, making the metal's price movements a real-time indicator of industrial health. The ratio's movements can offer early signals about manufacturing slowdowns or accelerations before they appear in official economic data.
The current ratio at 0.0015 suggests a substantial slowdown in global manufacturing activity. This is consistent with China's ongoing property market challenges and reduced construction demand, alongside manufacturing contraction in several major economies. The severity of the decline to levels approaching the 2009 crisis suggests industrial activity may be significantly weaker than official data currently indicates.
Market Applications
Investors, traders, and economists utilize the copper-to-gold ratio in various practical applications:
Trading Strategies
The relationship between the copper-to-gold ratio and other financial metrics creates opportunities for strategic trading. For instance, when the ratio diverges significantly from 10-year bond yields, traders may anticipate a reversion to the mean.
As noted in market analyses: "Back in 2018, bond yields were out-performing the copper/gold ratio by a wide margin. The ratio ended up reverting to the mean and catching up to the downside." This kind of divergence can signal trading opportunities across multiple asset classes.
However, the current situation with the ratio at 0.0015 may represent more than a temporary divergence requiring mean reversion. Instead, it could signal a structural economic shift with the global economy potentially operating permanently below its pre-2008 potential. In this environment, traditional mean-reversion strategies may be less effective, and traders might need to adapt to a "new normal" of persistently lower ratios reflecting prolonged economic caution.
Asset Allocation
Portfolio managers historically used the copper-to-gold ratio to inform value stock allocations. While a positive correlation was once assumed, recent data confirms that while S&P 500 Value has generally risen since 2013, the copper-to-gold ratio has fallen. This suggests a complex interplay of factors beyond simple economic expansion driving value stock performance, highlighting the need for a nuanced, rather than direct, interpretation of the ratio in modern asset allocation strategies.
As shown in the interactive chart above, value stocks (represented by the S&P 500 Value index) and gold often move in observable patterns relative to each other. During periods of economic expansion, value stocks typically outperform while gold may underperform. Conversely, during economic uncertainty, gold tends to strengthen as investors seek safe-haven assets, while value stocks may lag.
In the current environment, with the copper-to-gold ratio at critical lows of 0.0015, the traditional relationship would suggest significant caution toward value stocks. However, the complex interplay of monetary policy, government stimulus, and changes in market structure may create disconnects between historical relationships and present market behavior. Investors should consider this indicator alongside other metrics when making allocation decisions in this uncertain landscape.
Economic Forecasting
The ratio serves as an inflation-free economic indicator because dividing copper by gold eliminates the common factor (currency), providing a clearer view of relative value. This makes it particularly useful for economic forecasting as it often provides early signals of changing economic conditions.
"By comparing copper directly to gold rather than to a fiat currency, we can observe the true relationship between industrial activity and safe-haven demand without the distortions of monetary policy."
— Ali Karadag, CEO Blackmill Solutions
Historical Performance and Current Trends
The copper-to-gold ratio has demonstrated notable historical patterns through various economic cycles:
Historical Perspective
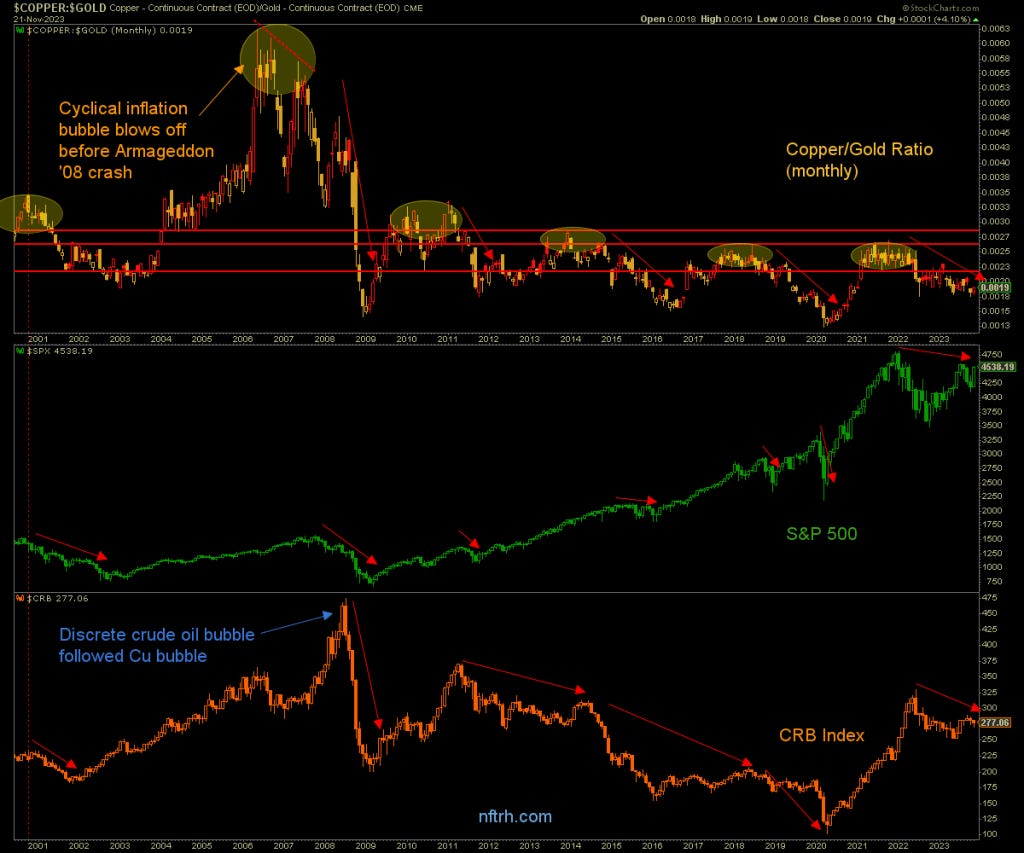
Gold massively outperformed copper during the 1970s after U.S. President Richard Nixon withdrew the dollar from the gold standard, eliminated the fixed exchange rate of $35 an ounce, and dismantled the Bretton Woods monetary system. The ratio plunged during this decade as inflation soared and central banks struggled to control it.
The ratio has since oscillated with copper largely ascending during the deregulatory policies of the Reagan and Thatcher administrations, with minor fluctuations in 1987, 1991-92, and 2000-03. Following the Great Financial Crisis, gold has shown persistent strength, suggesting market skepticism about using cheaper debt to solve a debt crisis.
Recent Volatility
The ratio has experienced significant volatility in recent years. The most recent multi-year high was observed in October 2021, following a nearly two-year rally from a multi-decade low in April 2020. During this period, the ratio surged over 100%. However, since October 2021, the ratio has been on a downward trend, with copper prices dropping by approximately 20% while gold prices have risen by 13%.
Current Market Alert (April 2025)
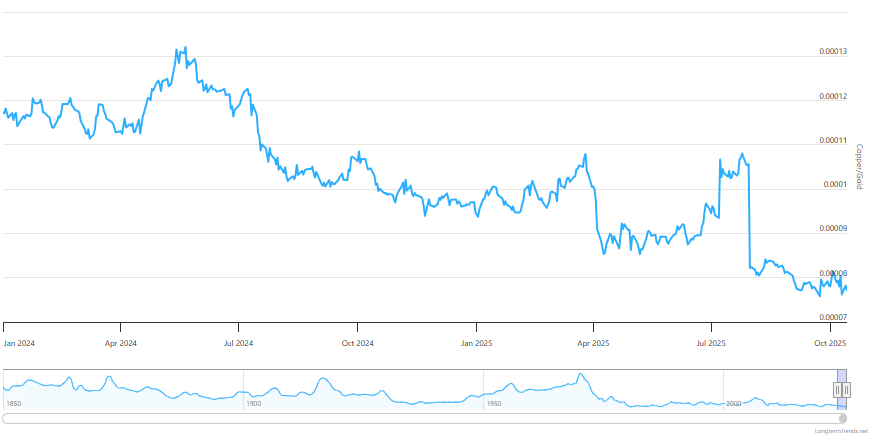
Recent market analysis shows the copper-to-gold ratio has fallen to 0.0015, levels not seen since August 2020 and barely above the 2009 financial crisis lows. This dramatic decline is particularly concerning as it comes despite current economic conditions appearing fundamentally different from those during the Great Recession.
This bearish signal aligns with other troubling indicators: Chinese government bond yields hover near record lows despite Beijing's stimulus "bazooka," while the Chicago Fed's National Activity Index fell to -0.40 in October, marking five consecutive months of negative readings—strongly suggesting the US may be entering or already within a recession.
The current levels of the copper-to-gold ratio are comparable to those seen during the Financial Crisis of 2008-2009, suggesting potential economic challenges ahead and reflecting investors' concerns about global growth prospects. The ratio's significant decline indicates a strong preference for gold as a safe-haven asset over copper, highlighting widespread economic pessimism despite various stimulus efforts.
Historical Highs
- October 2021: Post-pandemic recovery
- Early 2018: Global synchronized growth
- Mid-2000s: China's industrial boom
Historical Lows
- Current (2025): 0.0015, approaching 2009 crisis levels
- April 2020: COVID-19 pandemic outbreak
- 2008-2009: Global Financial Crisis
- Late 1970s: Stagflation era
Future Outlook and Influencing Factors
The current economic landscape shows concerning signals across multiple regions, suggesting the global economy may be operating below its pre-2008 potential with diminishing chances of full recovery. Several key factors are influencing the copper-to-gold ratio:
Global Economic Challenges (2025 Assessment)
- United States: Five consecutive months of negative readings in the Chicago Fed's National Activity Index combined with potential labor market weaknesses signal fundamental economic challenges.
- Europe: Initially expected to recover from its undeclared two-year recession in 2024, Europe instead shows signs of further contraction, with the ECB pivoting from "higher for longer" to considering rate reductions.
- China: Despite September stimulus announcements producing a brief uptick, Chinese bond yields have resumed their downward trajectory as the country faces a bursting real estate bubble with no clear growth engine on the horizon.
Rather than predicting another financial crisis like 2008, these indicators suggest a more structural issue—that the global economy may be permanently operating below its pre-crisis potential. Interest rates are likely to "go down quite a bit and stay there," creating a prolonged period of below-trend growth rather than a robust economic rebound.
Geopolitical Tensions
Geopolitical fears, such as conflicts between major powers, have affected recent price action in both gold and copper. Resolution of these tensions could allow the global economic recovery to proceed unimpeded, potentially driving the copper-to-gold ratio higher.
Inflationary Pressures
Growing inflationary pressures have been a major driver affecting recent price movements in gold and copper. The ratio remains responsive to inflation expectations, with gold particularly sensitive to this factor.
Chinese Economic Activity
With China consuming approximately half of global copper demand, its economic health significantly impacts the copper-to-gold ratio. Current economic slowdowns in China, including a bursting real estate bubble and stimulus measures failing to gain traction, are exerting significant downward pressure on the ratio despite Beijing's "bazooka" of stimulus measures.
Central Bank Policies
Monetary policy decisions, particularly regarding interest rates, significantly affect both metals and their relationship. Central banks are pivoting from hawkish stances to considering rate cuts, with the European Central Bank notably shifting from a "higher for longer" position to deliberating how quickly to reduce rates in response to economic weakness.

Conclusion
The copper-to-gold ratio represents more than a simple price relationship—it embodies the tension between growth and safety, between industrial activity and economic caution. For investors, traders, and economists, this ratio provides a valuable lens through which to view complex market dynamics.
Current data is particularly concerning, with the ratio falling to levels near those seen during the 2009 financial crisis. Combined with other troubling indicators such as the Chicago Fed's National Activity Index and Chinese bond yields, these metrics suggest the global economy may be operating permanently below its pre-2008 potential rather than facing a temporary setback.
While no single indicator can perfectly predict economic outcomes, the copper-to-gold ratio's demonstrated correlation with treasury yields, value stock performance, and broader economic conditions makes it a particularly valuable tool in the analyst's toolkit. For investors and policymakers alike, these signals suggest the need to prepare for a prolonged period of below-trend growth rather than anticipating a robust economic rebound.
Key Takeaways
- The copper-to-gold ratio compares an industrial metal to a safe-haven asset, providing insights beyond traditional economic indicators
- A rising ratio signals economic expansion and risk appetite, while a falling ratio indicates uncertainty and potential economic slowdown
- The ratio has demonstrated a strong correlation with 10-year U.S. Treasury yields, as shown in our interactive data visualization using real Federal Reserve data
- Current data shows the ratio has fallen to 0.0015, approaching 2009 financial crisis lows, despite fundamentally different economic conditions
- Recent economic indicators including the Chicago Fed's National Activity Index suggest the US may be entering or within a recession
Frequently Asked Questions About the Copper-to-Gold Ratio
How is the copper-to-gold ratio calculated?
Why is the copper-to-gold ratio considered an inflation-free indicator?
What does a falling copper-to-gold ratio typically indicate?
How does the copper-to-gold ratio relate to Treasury yields?
How can investors use the copper-to-gold ratio in portfolio management?
What factors currently influence the copper-to-gold ratio?
Continue Your Research
Real Estate vs Gold: Which is the Better Store of Value?
How gold and real estate compare as stores of value, and what their relationship reveals about true asset performance beyond currency effects.
Read moreTech Stocks Underperforming in Gold Terms: Nasdaq's Gold Recession
Discover why tech stocks are experiencing a 'gold recession' since 2021 despite rising dollar prices. Our data-driven analysis reveals true value trends beyond inflation effects.
Read moreGold-to-Silver Ratio: What It Tells Investors About Market Cycles
Understanding the historical patterns of the gold-to-silver ratio and how it signals market opportunities and economic transitions.
Coming soon