
The gold mining industry stands at a pivotal moment in 2025, characterized by unprecedented profit margins, rising operational costs, and a technological revolution that promises to reshape the sector fundamentally. While gold prices have soared to historic highs above $3,500 per ounce, mining companies face a complex landscape of challenges and opportunities that will define the industry’s future trajectory.
Record Profitability Masking Underlying Pressures
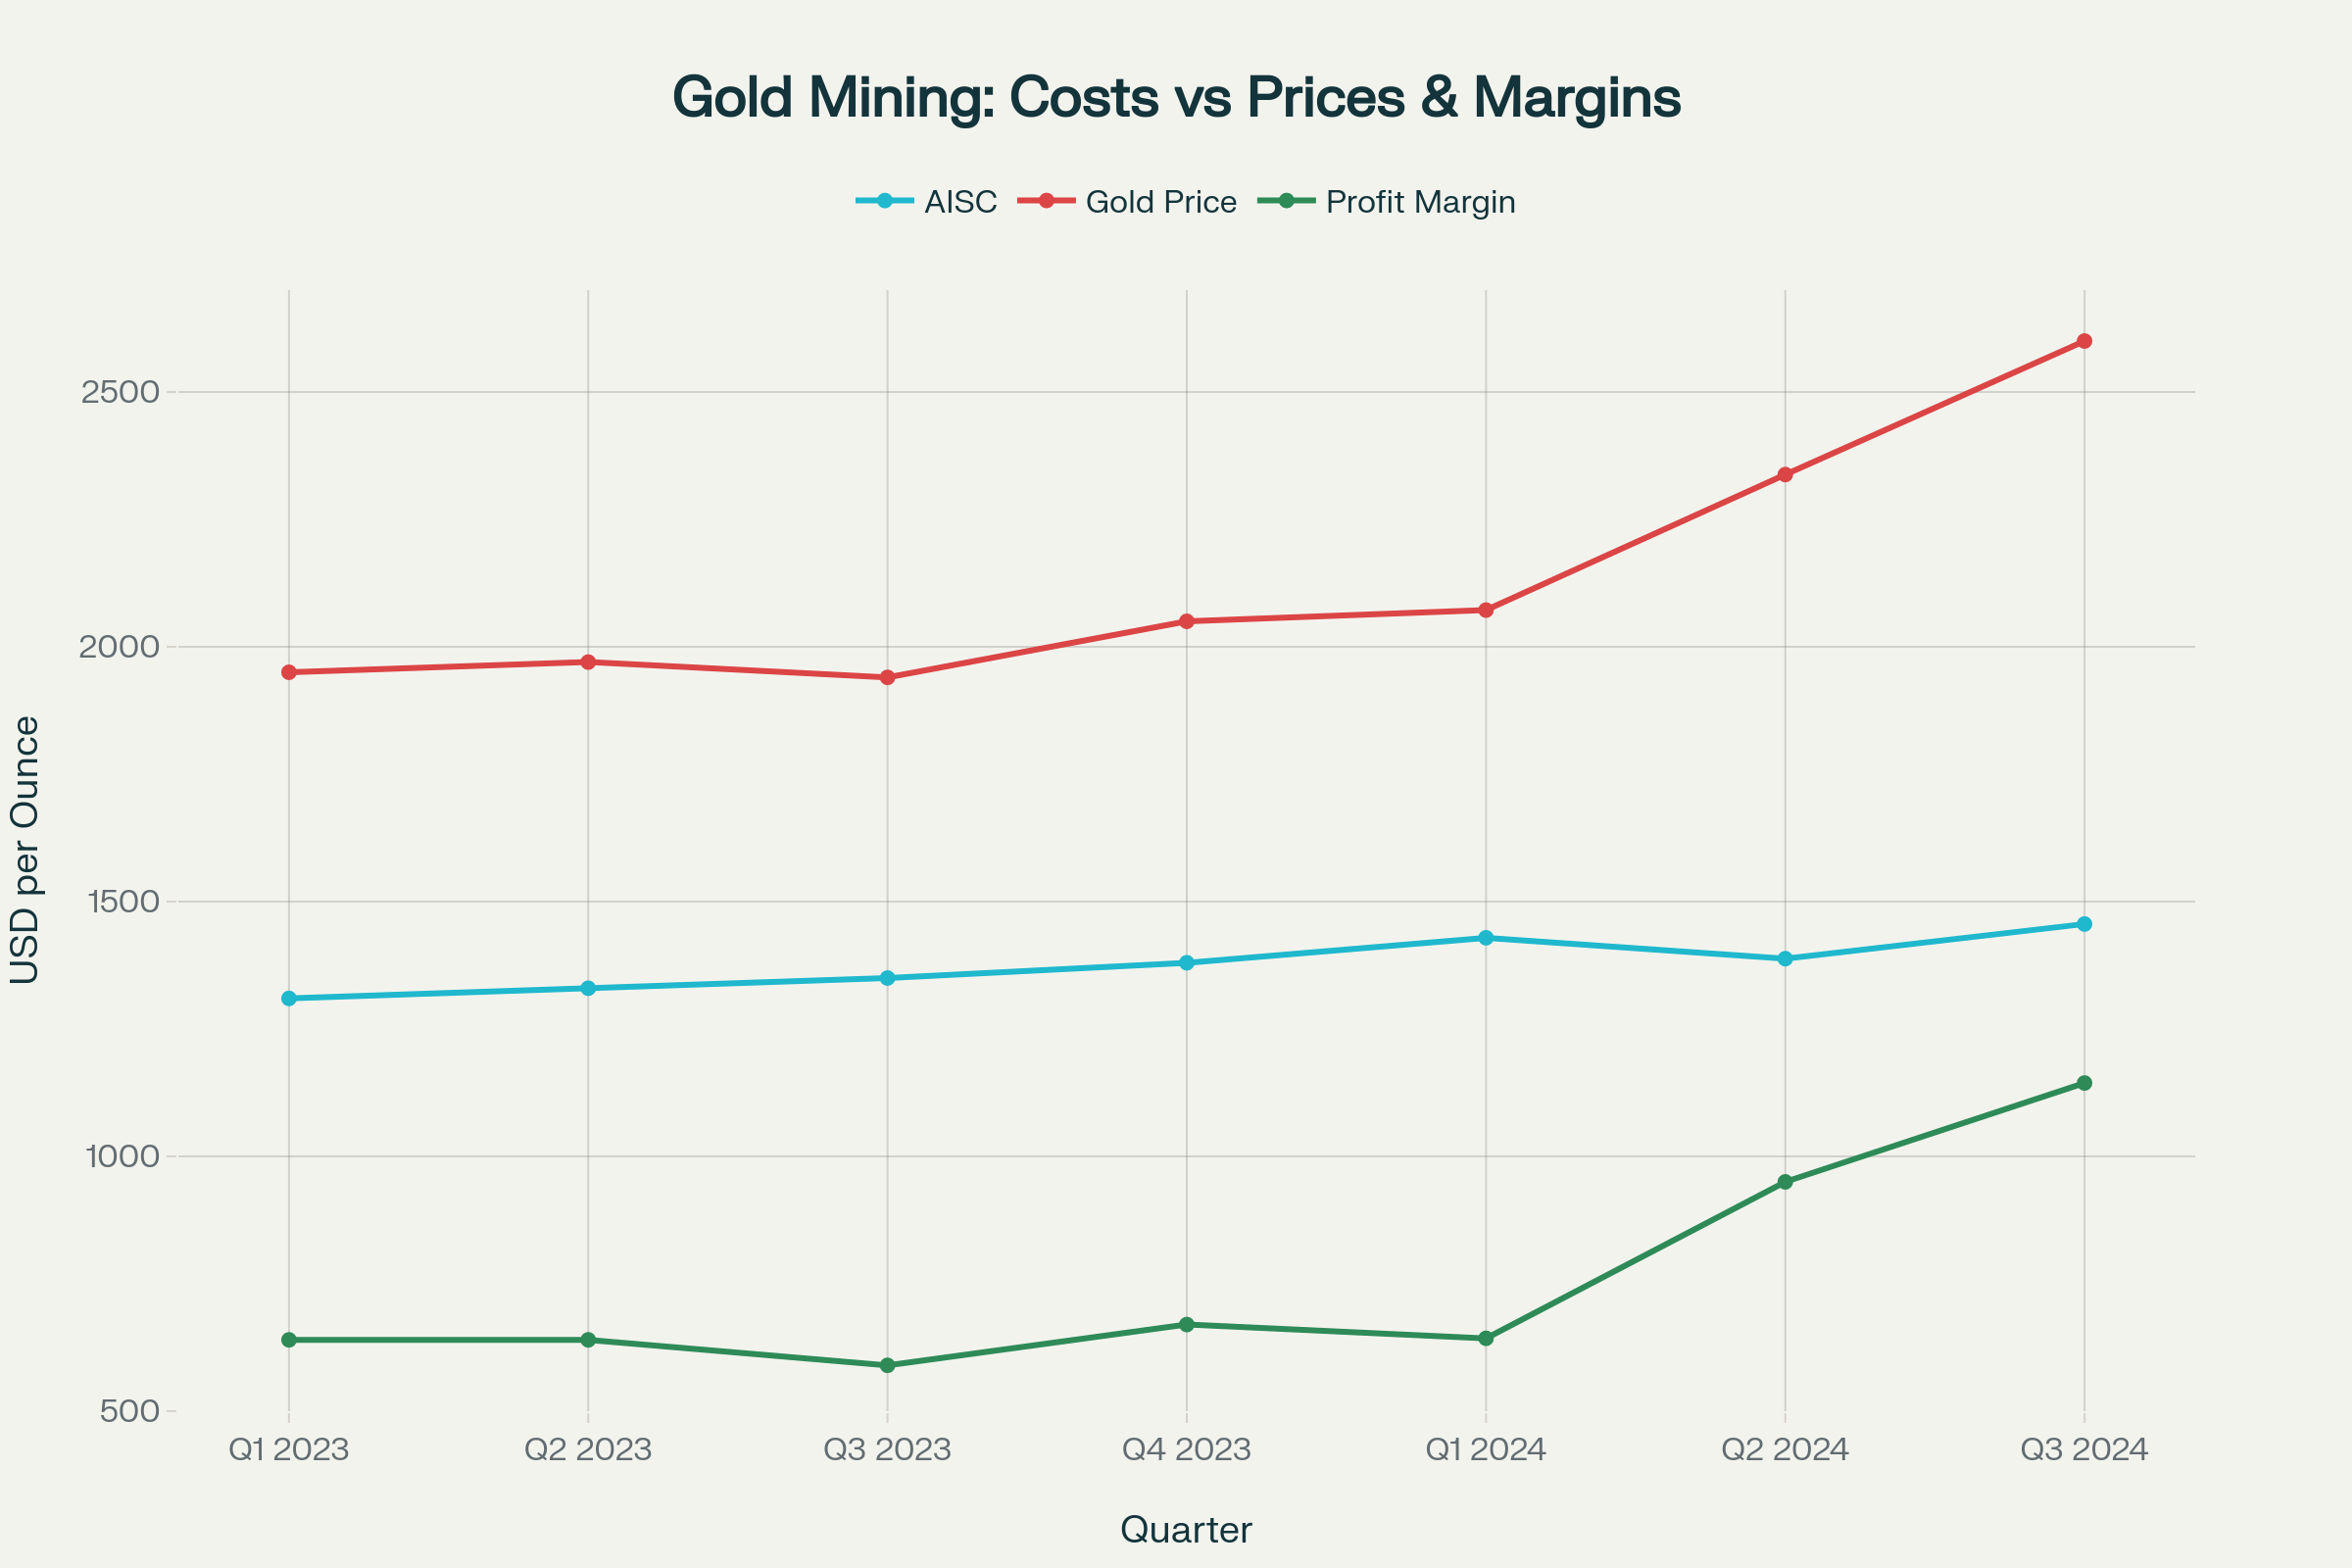
Despite persistent challenges, the gold mining sector is experiencing exceptional profitability. All-in sustaining costs (AISC) reached $1,456 per ounce in Q3 2024, the highest point in over a decade, yet average producer margins simultaneously hit $1,144 per ounce—the strongest since 2012. This paradox underscores the industry’s current reality: 97% of primary gold production remained profitable in Q3 2024, demonstrating the remarkable buffer provided by soaring gold prices.
The industry is witnessing unprecedented free cash flow generation, with major producers achieving margins that would have been considered impossible just years ago. Companies like Agnico Eagle are reporting gross margins of 38% and operating margins exceeding 34%, while the sector collectively benefits from what analysts describe as “record AISC margins”. This financial strength is enabling significant capital allocation toward expansion, acquisition, and technological advancement.
Regional Production Dynamics and Investment Flows
Asia Leads Global Production
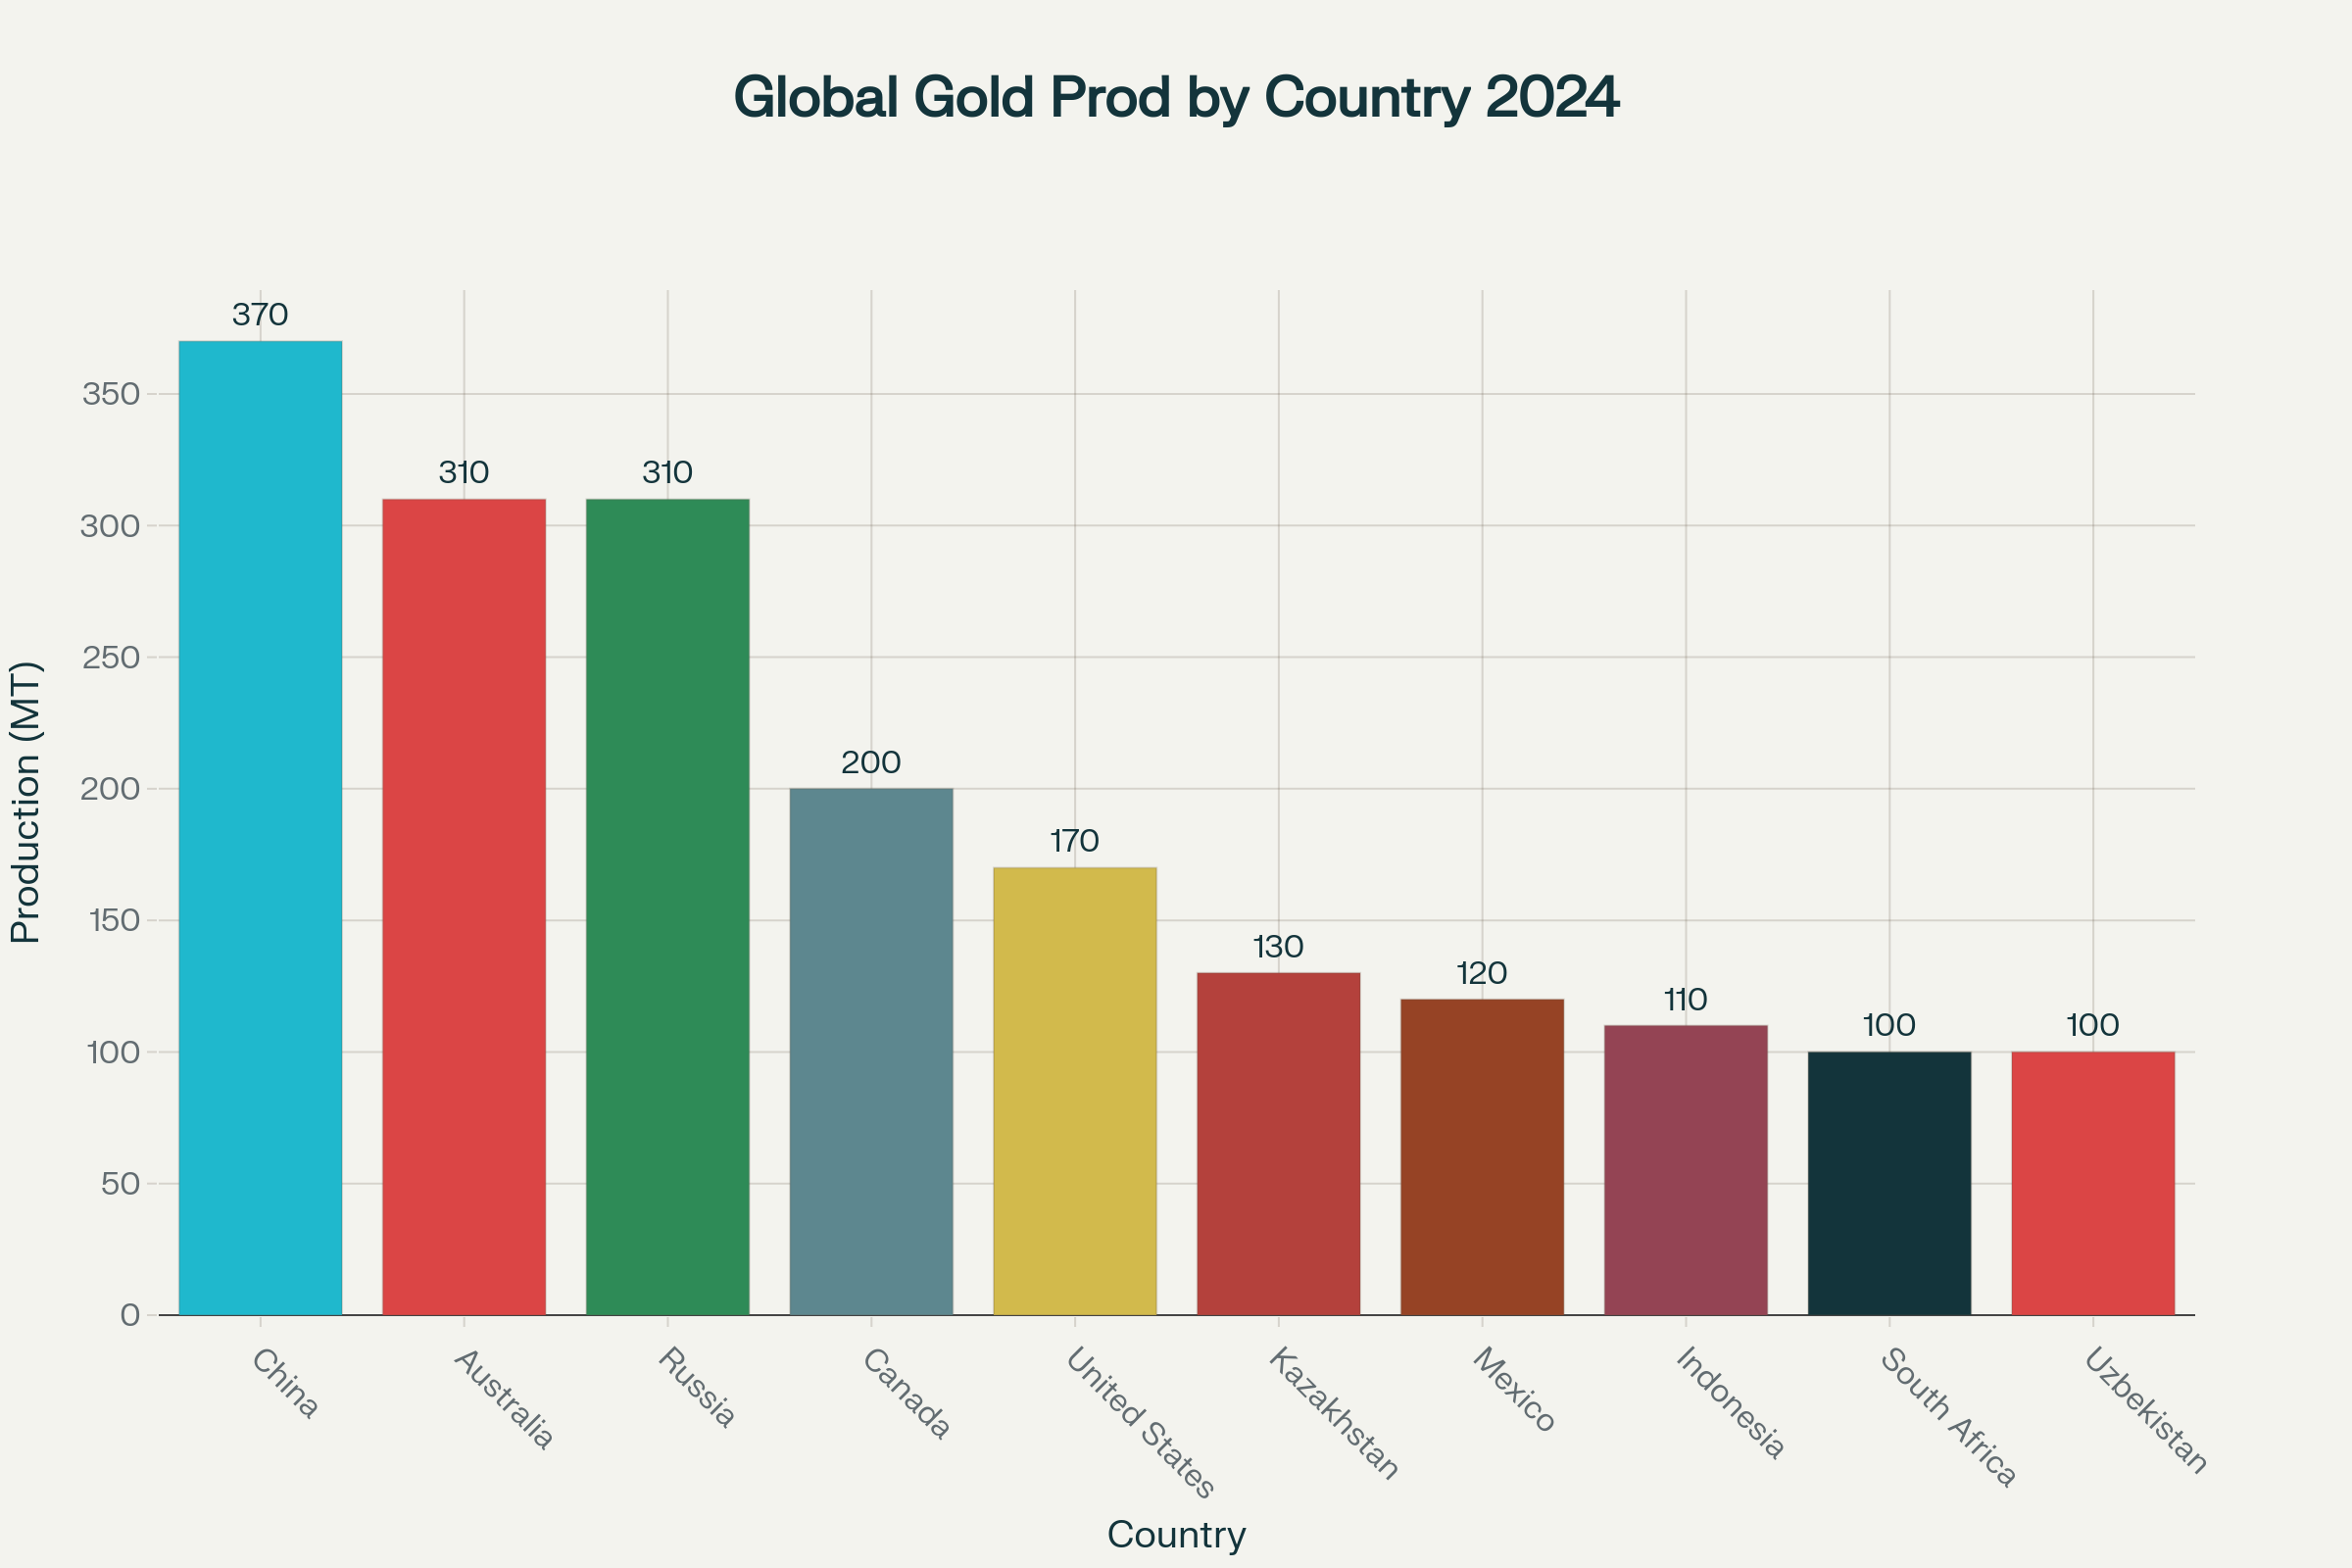
China maintains its position as the world’s largest gold producer, extracting 370 metric tonnes in 2024, representing approximately 10% of global production. This leadership reflects both substantial domestic reserves and aggressive investment in mining technology and infrastructure. Asia collectively produces over 710 metric tonnes annually, nearly 40% of global output, with significant contributions from Kazakhstan (130 MT), Indonesia (110 MT), and Uzbekistan (100 MT).
North American Resilience
North America continues to demonstrate operational excellence, producing 490 metric tonnes across Canada (200 MT), the United States (170 MT), and Mexico (120 MT). Canadian operations, particularly those managed by companies like Evolution Mining at Red Lake, have achieved record performance metrics with annual records for ore mined and processed. The region benefits from stable regulatory environments, advanced infrastructure, and significant investment in automation technologies.
African Investment Surge
West Africa has emerged as one of the most dynamic gold-producing regions, with over 15 million ounces produced in 2024. Ghana alone generated $5 billion in revenue from its artisanal sector, while major projects like Cardinal Resources’ Namdini Mine are positioned to produce 358,000 ounces annually starting in mid-2025. The region attracted over $4 billion in M&A activity during 2024, representing a thirteen-fold increase from 2023 levels.
Chinese acquirers have become particularly aggressive, with Zijin Mining paying $1 billion for Newmont’s Akyem project in Ghana at significant premiums over regional averages. This trend reflects both strategic resource securing and confidence in African operational capabilities despite historical geopolitical concerns.
The M&A Mega-Deal Phenomenon
The mining sector is experiencing unprecedented consolidation, with 18 deals exceeding CA$1 billion announced or completed between January 2024 and mid-2025, totaling approximately CA$47 billion. This activity surpasses post-super-cycle peaks and represents fundamental strategic repositioning rather than speculative expansion.
Gold dominated this activity, accounting for over $26.54 billion across 62 deals in 2024—70% of global mining deal value. Strategic acquisitions like Orla Mining’s $850 million purchase of Newmont’s Musselwhite mine demonstrate how companies are acquiring immediate cash flow and operational capabilities rather than development-stage assets.
Technological Revolution: AI and Automation Transform Operations
Autonomous Operations Achieve Scale
The deployment of autonomous systems has reached commercial maturity across major operations. Rio Tinto operates approximately 200 trains through its AutoHaul technology, while 80% of its Pilbara haul truck fleet operates autonomously. BHP has automated over 30% of trucks at its Western Australian iron ore operations, with AI-driven decision-making systems enhancing both safety and operational efficiency.
These systems deliver measurable benefits: continuous 24/7 operation without fatigue-related performance degradation, precise excavation reducing ore dilution, and significant reduction in human exposure to hazardous environments. Over 60% of global gold mines are expected to implement AI-powered automation systems by 2025.
AI-Driven Exploration and Processing
Artificial intelligence is revolutionizing mineral exploration through advanced data analytics and machine learning algorithms that analyze geological data, satellite imagery, and historical exploration records. Companies like Goldspot Discoveries, Earth AI, and Minerva Intelligence are leading this transformation, offering AI-driven solutions for resource identification and operational optimization.
The industry expects to spend $218 million on AI platforms worldwide by 2024, up from $76 million in 2019, representing a compound annual growth rate of 23.4%. These investments focus on predictive maintenance, autonomous equipment operation, real-time data analytics, and ore grade optimization.
Green Mining Technologies
Environmental sustainability has become central to operational strategy, driven by both regulatory requirements and investor demands. Over 60% of new mining policies in 2025 mandate advanced environmental monitoring for sustainability compliance. Companies are implementing electric and hydrogen-powered equipment, bioleaching processes, and AI-driven closed-loop water systems.
Gold Fields’ Agnew Mine in Australia has become one of the first operations to utilize comprehensive hybrid renewable energy solutions incorporating wind, solar, and battery storage. B2Gold’s Otjikoto Mine in Namibia derives 30-40% of its power from solar sources, demonstrating the commercial viability of renewable integration.
Rising Cost Pressures and Operational Challenges
Inflation and Labor Cost Escalation
The industry faces persistent inflationary pressures across multiple cost categories. Labor expenses have particularly impacted operations, with Australian mining wages rising 4% year-over-year, reflecting broader wage inflation trends in key producing regions. Major companies including Newmont, AngloGold Ashanti, and Harmony Gold have reported significant labor cost increases across operations in Argentina, Ghana, South Africa, and Papua New Guinea.
Declining Ore Grades and Resource Depletion
A fundamental challenge confronting the industry is the scarcity of new, high-grade deposits. Gold is becoming increasingly difficult to find, with the World Gold Council noting that easy-to-access deposits have been largely exploited. This reality forces companies to process lower-grade ores and explore more remote, technically challenging locations, directly impacting cost structures and operational complexity.
Emissions intensity rose 3% in 2024 as lower ore grades forced miners to process more rock for equivalent gold output. This dynamic illustrates why gold mining is considered a “hard-to-abate” sector in global climate policy, as even technological improvements struggle to offset the fundamental challenge of declining resource quality.
Regulatory and Environmental Compliance Costs
Environmental, Social, and Governance (ESG) requirements have evolved from reputational considerations to fundamental business imperatives affecting financing, permitting, and operational licenses. Only 24% of institutional investors consider gold miners “very good” at adhering to industry-wide ESG standards, with two-thirds viewing performance as merely “quite good”.
Rising royalties and production taxes followed gold price increases, with average royalties reaching $85 per ounce in Q2 2024—a 22% year-over-year increase. Companies face mounting pressure to demonstrate measurable ESG improvements, with 24% of investors anticipating dramatic improvements over the next five years.
Emerging Players and Market Dynamics
New IPO Activity and Capital Formation
The sector has witnessed significant new entrants through public offerings and strategic repositioning. Zijin Gold International’s Hong Kong IPO raised $2.56 billion, becoming the largest IPO in the global gold mining sector and the second-largest offering worldwide in 2025. This transaction demonstrated robust institutional appetite for quality gold mining assets.
Indonesia’s PT Merdeka Gold Resources completed the country’s largest IPO of 2025, raising $284 million and representing approximately 15% of Indonesia’s total IPO proceeds for the year. These transactions indicate renewed confidence in gold mining fundamentals despite operational challenges.
Junior Mining Success Stories
Junior mining companies have experienced exceptional performance, with the best-performing new issues of 2024 including Goldgroup Mining (up 433%), Ramp Metals (up 332%), and Adelphi Metals (up 122%). These companies benefit from focused exploration programs, strategic partnerships with major producers, and access to underexplored regions with significant discovery potential.
Innovation in Mining Methods and Technologies
Deep-Sea Mining Emergence
Deep-sea mining represents a potential paradigm shift for critical mineral extraction, including gold recovery from polymetallic nodules. The Clarion-Clipperton Zone alone contains over 21 billion metric tons of nodules, with significant gold content alongside copper, nickel, and cobalt. The global economic opportunity from seabed mining could reach $20 trillion, with mining 75,000 square kilometers potentially generating $21-42 billion in gross metal value over two decades.
The U.S. administration has accelerated permitting processes for companies to mine in both international and U.S. territorial waters, while Norway announced intentions to allow exploration permits in 2025. This emerging sector could fundamentally alter global gold supply dynamics within the next decade.
Bioleaching and Sustainable Extraction
Bio-mining utilizing microorganisms to separate metals from minerals offers environmentally superior alternatives to traditional chemical processes. In-situ leaching techniques dissolve minerals without removing rock from the ground, significantly reducing surface disruption and waste generation. These methods align with increasing environmental regulations while potentially reducing operational costs.
Satellite-Driven Monitoring and Management
Advanced satellite monitoring combined with AI analytics enables real-time operational oversight, environmental compliance tracking, and resource optimization. These systems provide continuous monitoring capabilities for remote operations while supporting regulatory reporting requirements and ESG compliance frameworks.
Regional Exploration Hotspots and New Discoveries
Canadian Arctic and Subarctic Expansion
Canada continues attracting significant exploration investment, with companies like B2Gold allocating $32 million for exploration at the Back River Gold District in 2025. The Goose Project remains on track for first gold production in Q2 2025, with 12,000 meters of drilling planned to target extensions of the Llama and Umwelt deposits.
West African Discovery Potential
West Africa has yielded 95 million ounces of gold discoveries over the past 20 years, compared to Canada’s 61 million ounces and Australia’s 29 million ounces, demonstrating exceptional exploration potential. Companies like Predictive Discovery are advancing the Bankan Gold Mine in Guinea, a three-million-ounce project expected to begin production in early 2027 with annual output of 269,000 ounces.
Australian Victorian Renaissance
Victoria, Australia, is experiencing renewed exploration interest, with companies like Southern Cross Gold reporting exceptional drill results including 1 meter at 2,318.4 g/t gold. Golden Cross Resources has acquired strategic tenements near Southern Cross’s Sunday Creek discovery, positioning for potential major discoveries in the historically productive region.
Challenges Ahead: Sustainability, Costs, and Resource Scarcity
Environmental Stewardship Requirements
The industry faces escalating environmental compliance requirements, with aggregate Scope 1 and 2 emissions falling below 30,000 kilotons for the first time in a decade, yet emissions intensity continuing to rise due to lower ore grades. Companies must balance operational efficiency with environmental responsibility while maintaining profitability in an increasingly regulated environment.
Water use intensity increased as recycling rates slipped from 72% to 70%, highlighting ongoing challenges in resource management. Many operations occur in arid regions or near agricultural communities, creating potential conflicts over water resources that could impact future development projects.
Capital Allocation and Investment Priorities
Sustaining capital expenditures reached $301 per ounce in Q2 2024, up 5% both quarterly and annually. Companies must balance immediate production maintenance with long-term growth investments while managing shareholder expectations for returns during periods of exceptional profitability.
The challenge becomes more acute as easily accessible deposits become exhausted, requiring higher capital intensity for equivalent production levels. This dynamic creates pressure for continued consolidation and efficiency improvements to maintain competitive positioning.
Investment Implications and Future Outlook
Margin Sustainability and Price Sensitivity
While current margins appear exceptional, the industry’s reliance on elevated gold prices introduces significant risk should precious metal valuations correct. Companies with higher AISC face greater vulnerability to price volatility, emphasizing the importance of operational efficiency and cost management capabilities.
The mixed regional performance in Q3 2024 suggests that the tide may be beginning to turn regarding cost escalation, with some operations achieving cost reductions through improved operational efficiency and technological implementation.
Strategic Positioning for Long-Term Success
Companies achieving sustainable competitive advantages combine several characteristics: operational excellence with below-average AISC, significant reserve bases in politically stable jurisdictions, advanced technological implementation, strong ESG performance, and robust balance sheets enabling strategic flexibility during market volatility.
The sector’s transformation toward AI-driven, environmentally sustainable operations represents both challenge and opportunity. Companies successfully navigating this transition will likely outperform peers as regulatory requirements tighten and investor demands for responsible mining intensify.
Conclusion: Navigating the New Gold Mining Paradigm
The gold mining industry in 2025 exemplifies a sector in profound transition, balancing record profitability with structural challenges that will define its future trajectory. While elevated gold prices provide exceptional financial flexibility, companies face mounting pressures from rising costs, environmental compliance, resource depletion, and technological transformation requirements.
Success in this environment demands strategic focus on operational excellence, technological innovation, and environmental stewardship. Companies that successfully integrate AI-driven automation, sustainable practices, and strategic capital allocation will likely emerge as leaders in the industry’s next phase of development.
The ongoing consolidation through mega-deals, emergence of new technologies like deep-sea mining, and expansion into underexplored regions suggest the industry’s continued evolution. However, the fundamental challenge of finding and economically extracting gold in an environmentally responsible manner will continue driving innovation and strategic decision-making across the sector.
For investors and industry participants, the current environment offers both exceptional opportunities and significant risks. The companies that thrive will be those that successfully balance immediate profitability with long-term sustainability, positioning themselves for success in an industry undergoing its most significant transformation in decades.