The Gold-Silver Ratio
A powerful market indicator and strategic investment tool revealing economic conditions through the relative performance of precious metals.

Ali Karadag
Software Architect & Precious Metals Analyst
Key Insights
- The gold-silver ratio is a powerful market indicator calculated by dividing the price of gold by the price of silver, showing how many ounces of silver it takes to buy one ounce of gold
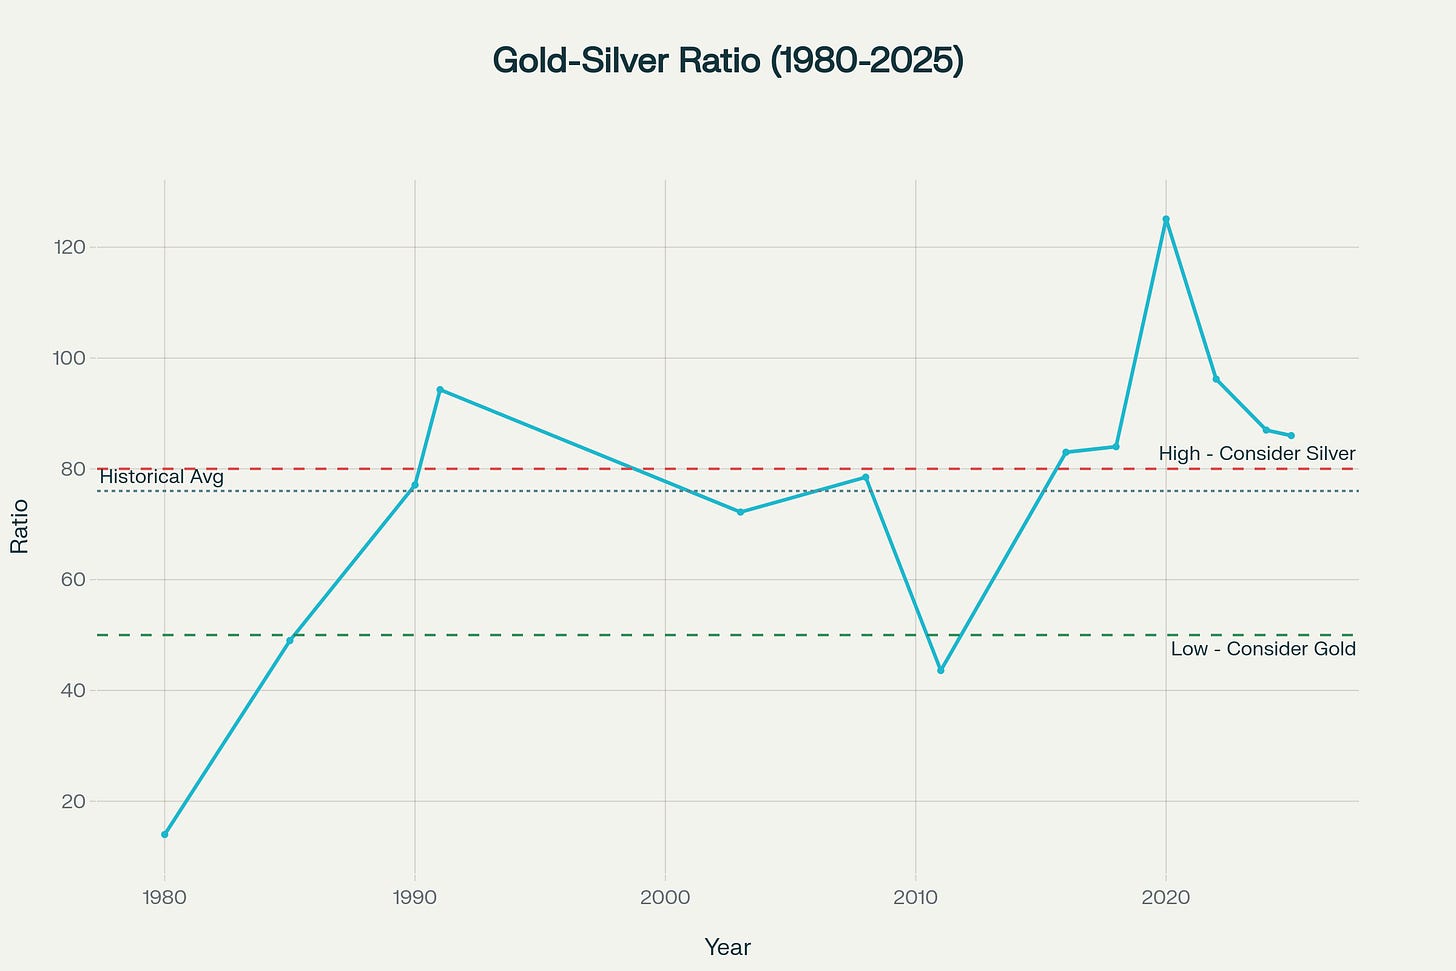
- Historical data shows the ratio has ranged from as low as 2.5:1 in ancient Egypt to an all-time high of 125:1 during the 2020 COVID-19 pandemic
- A high ratio (above 80:1) typically signals economic uncertainty and risk aversion, while a declining ratio indicates improving economic growth prospects and increased risk appetite
- The ratio trade strategy involves converting between metals at extreme ratio levels, which has historically allowed investors to increase their total precious metals holdings
- As of May 2025, the ratio has declined below 100:1 from its 2024 average of 110:1, suggesting potential silver outperformance and improved economic sentiment
Introduction: The Gold-Silver Ratio as a Market Barometer
The gold-silver ratio has emerged as one of the most enduring and insightful metrics in precious metals investing, offering valuable signals about market conditions and potentially lucrative trading opportunities. As of May 2025, with the ratio recently declining below the 100:1 mark, investors are closely watching this indicator for clues about the future direction of both metals and broader economic conditions.
Unlike tracking the absolute prices of either metal individually, the ratio provides insight into their relative performance and offers a comparative value assessment that has guided investors for centuries. This analysis explores the historical significance, current market implications, and future prospects of this powerful market indicator.
Gold-Silver Ratio Snapshot
Understanding the Gold-Silver Ratio: Definition and Calculation
The gold-silver ratio (GSR) represents the number of ounces of silver required to purchase one ounce of gold. This simple yet powerful metric is calculated by dividing the current price of gold by the price of silver. For example, with gold trading at $3,300 per ounce and silver at $33 per ounce (as of April 2025), the ratio stands at 100:1.
Calculation Example
Gold Price
$3,300
per ounce
Silver Price
$33
per ounce
Gold-Silver Ratio
100:1
$3,300 ÷ $33 = 100
This ratio functions as a relative value indicator, enabling investors to compare the two metals' performance over time and revealing shifts in market preference between these assets. These shifts often reflect broader economic conditions such as inflation expectations or risk appetite changes. Market analyst Patrick Kim has described the GSR as a "Rosetta Stone" for interpreting macroeconomic trends, underscoring its importance beyond mere price comparison.
Unlike individual metal prices which can be distorted by currency fluctuations, the ratio offers a currency-neutral perspective on relative valuation. This makes it particularly valuable during periods of monetary instability when investors seek to understand the intrinsic relationships between precious metals.
Historical Evolution of the Gold-Silver Ratio
The gold-silver ratio holds the distinction of being the oldest continuously tracked exchange rate in history. Its journey through time reveals both remarkable stability in pre-modern eras and increasing volatility in modern financial markets.
Ancient and Medieval Periods
The earliest historical records of the ratio date back to around 3200 BCE in ancient Egypt, when it was documented at a remarkably low 2.5:1, established by King Menes. The Roman Empire's ratio fluctuated between 8:1 and 12:1, with Julius Caesar setting it at 11.5:1 and Augustus later raising it to 11.75:1. This demonstrates how early civilizations recognized the relationship between these two precious metals and attempted to codify their relative values.
Ancient Egypt
2.5:1
3200 BCE
Early Roman
8:1
~210 BCE
Late Roman
11.75:1
Augustus Era
Medieval Europe
9.4-12:1
1350-1450 CE
In Medieval Europe, the ratio dropped to 9.4:1 around 1350, before rising to 12:1 by the 1450s. These relatively stable ratios through antiquity and the medieval period contrast sharply with the volatility seen in modern times.
The Era of Government Control
For hundreds of years, governments fixed the gold-silver ratio to maintain monetary stability. The United States Coinage Act of 1792 established the ratio at 15:1, confirming the dollar as the standard currency unit. Throughout the 19th century, the ratio generally hovered around 15:1 to 16:1, reflecting these government-fixed standards. These fixed ratios were attempts to create stable bimetallic monetary systems, though they often led to unexpected consequences, such as the hoarding of undervalued metals.
"The ratio of the value of gold to that of silver in all coins... shall be fifteen to one."
This government-mandated approach to the ratio differs dramatically from today's market-determined rates, highlighting how the relationship between these metals has evolved from a legal construct to a market-driven indicator.
Modern Volatility
The 20th century marked a dramatic shift in the ratio's behavior. After the discovery of massive silver deposits in the Americas and various government attempts to manipulate precious metal prices, the ratio began experiencing unprecedented volatility. When President Roosevelt set gold's price at $35 an ounce in 1934, the gold-silver ratio climbed dramatically, reaching 98:1 by 1939.
Following the Bretton Woods Agreement of 1944, which pegged foreign exchange rates to gold, the ratio steadily declined. However, when the U.S. abandoned the last remnants of the gold standard in the 1970s, the ratio rose rapidly through the 1980s, peaking at 94.3:1 in 1991 as silver prices fell below $4 an ounce.
Modern Era Gold-Silver Ratios (1968-2025)
Year/Period | Ratio | Context |
---|---|---|
1968 | 16-17:1 | Close to historical fixed rates |
1971 | 27.7:1 | End of Bretton Woods |
1974 | 31-37:1 | Post-gold standard transition |
January 1980 | 14:1 | Silver price spike (Hunt Brothers) |
1981-1986 | 45-76:1 | Increasing volatility |
1991 | 94.3:1 | Silver price collapse |
2000 | 54.9:1 | Millennium/dot-com era |
2011 | 35:1 | Silver rally post-financial crisis |
2015 | 75.4:1 | Commodity slump |
2018 | 76.7-84:1 | Rising interest rates |
Recent History
The 20th century average for the gold-silver ratio was 47:1, while the 21st century has seen it mainly range between 50:1 and 70:1, with several notable excursions above this range. The ratio reached extreme levels during crisis periods:
Gold-Silver Ratio During Recent Crisis Periods
Crisis Period | Ratio Peak | Date | Silver Movement After Peak |
---|---|---|---|
2008 Financial Crisis | 84:1 | October 2008 | +300% over 2 years |
COVID-19 Pandemic | 125.1:1 | April 2020 | +100% within 6 months |
2023 Banking Crisis | 91:1 | March 2023 | +35% over 9 months |
2024 Trade Tensions | 85:1 | July 2024 | +28% over 5 months |
2025 Current | ~99:1 | May 2025 | Ongoing |
Pre-20th Century Average
~15:1
When fixed by governments
20th Century Average
47:1
Transition to market-determined
Free Market Average (since 1970s)
65:1
Modern market dynamics
These fluctuations represent significant departures from what might be considered the "natural" ratio. Based on the relative abundance of these metals in the Earth's crust (approximately 15 times more silver than gold), a ratio closer to 15:1 might be expected. The dramatic difference between this geological ratio and modern market ratios highlights the complex factors now influencing precious metals pricing.
The shift from government-fixed ratios to market-determined prices has fundamentally altered the behavior of the gold-silver ratio, with much higher averages and increased volatility becoming the norm in the modern era.
The Gold-Silver Ratio as a Market Indicator
The gold-silver ratio serves as much more than a simple price relationship—it functions as a sophisticated market indicator that can signal economic conditions, investor sentiment, and potential market turning points.
Interpreting Ratio Movements
Changes in the gold-silver ratio often precede broader market shifts, making it a valuable leading indicator for investors. Understanding how to interpret these movements can provide insight into both metals markets and the broader economic landscape.
↑ High Ratio (80+)
- •Gold outperforming silver (economic uncertainty)
- •Investors seeking safety in gold as crisis hedge
- •Concerns about economic growth dampening silver's industrial demand
- •Risk aversion dominating market sentiment
↓ Declining Ratio
- •Silver outperforming gold ("risk-on" environment)
- •Economic growth prospects improving, boosting industrial applications
- •Rising inflation expectations (historically favoring silver)
- •Increased risk appetite among investors
The dual nature of silver—serving as both a precious metal and an industrial commodity—creates this distinctive relationship. During periods of economic concern, investors typically favor gold's pure monetary role, driving the ratio higher. Conversely, when economic optimism returns, silver's industrial applications become more valuable, often causing the ratio to decline.
Patterns and Extremes
Historically, the gold-silver ratio tends to oscillate between approximately 20:1 at the low end and 100:1 at the high end. When the ratio approaches these extremes, it often signals potential reversal points that can lead to significant price movements in both metals.
Recent Gold-Silver Ratio Movement (2018-2025)
2020 pandemic peak of 125.1:1 followed by compression to current level of 99:1
For example, after the ratio peaked at 125.1:1 during the COVID-19 pandemic in 2020, silver prices doubled within just six months. Similarly, following the 2008 financial crisis peak of 84:1, silver rose 300% over the next two years. These examples demonstrate the ratio's value as both a market timing tool and a potential predictor of silver outperformance following extreme ratio readings.
Trading Strategies Using the Gold-Silver Ratio
The gold-silver ratio's tendency to revert to historical means over time has given rise to specific trading strategies that sophisticated investors use to maximize their precious metals holdings.
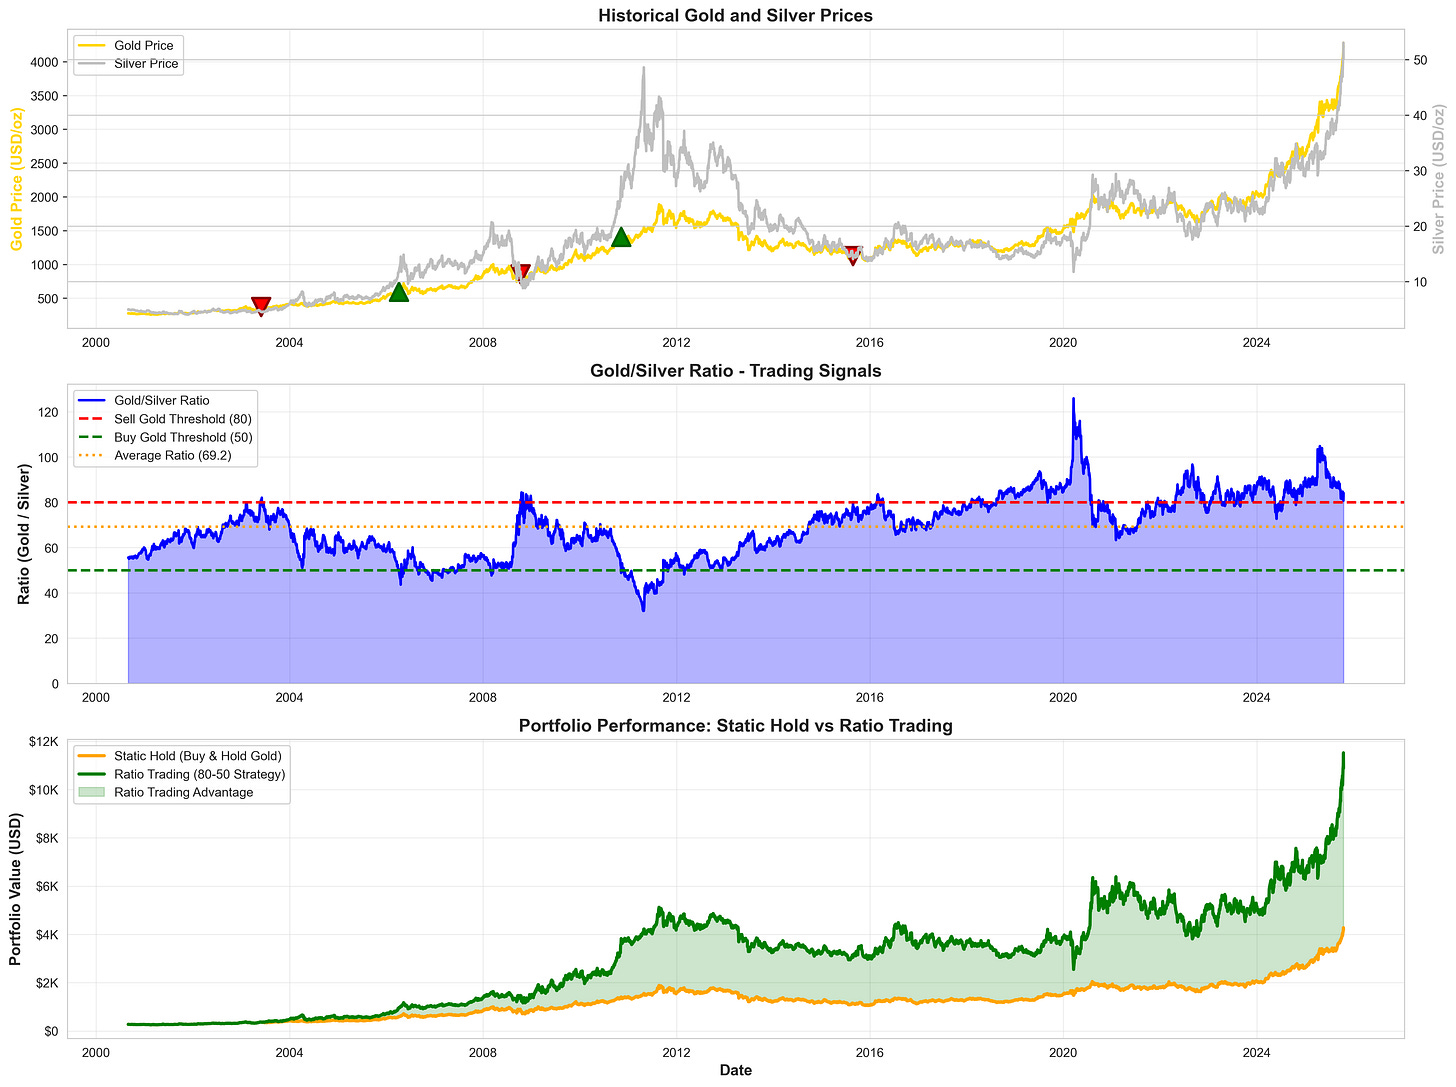
The Ratio Trade
The fundamental strategy for trading the gold-silver ratio involves switching between the two metals when the ratio reaches extreme levels. This approach doesn't necessarily require additional capital investment but instead focuses on increasing one's total ounces of precious metals by timing conversions effectively.
The Ratio Trade Strategy
Allocate to Gold When Ratio is Low
When the gold-silver ratio is at historical lows (typically below 40:1), allocate heavily to gold as it appears undervalued relative to silver.
Wait for Ratio Peak
Monitor the ratio until it reaches a potential peak (typically above 80:1), indicating silver is now undervalued relative to gold.
Convert Gold to Silver
Exchange gold holdings for silver. At a ratio of 80:1, one ounce of gold buys 80 ounces of silver.
Wait for Ratio Trough
Hold the silver position until the ratio falls to a potential trough (typically below 50:1), indicating gold is again undervalued.
Convert Silver Back to Gold
Exchange silver holdings back to gold. If the ratio has fallen to 40:1, the 80 ounces of silver now buys 2 ounces of gold, doubling the initial position.
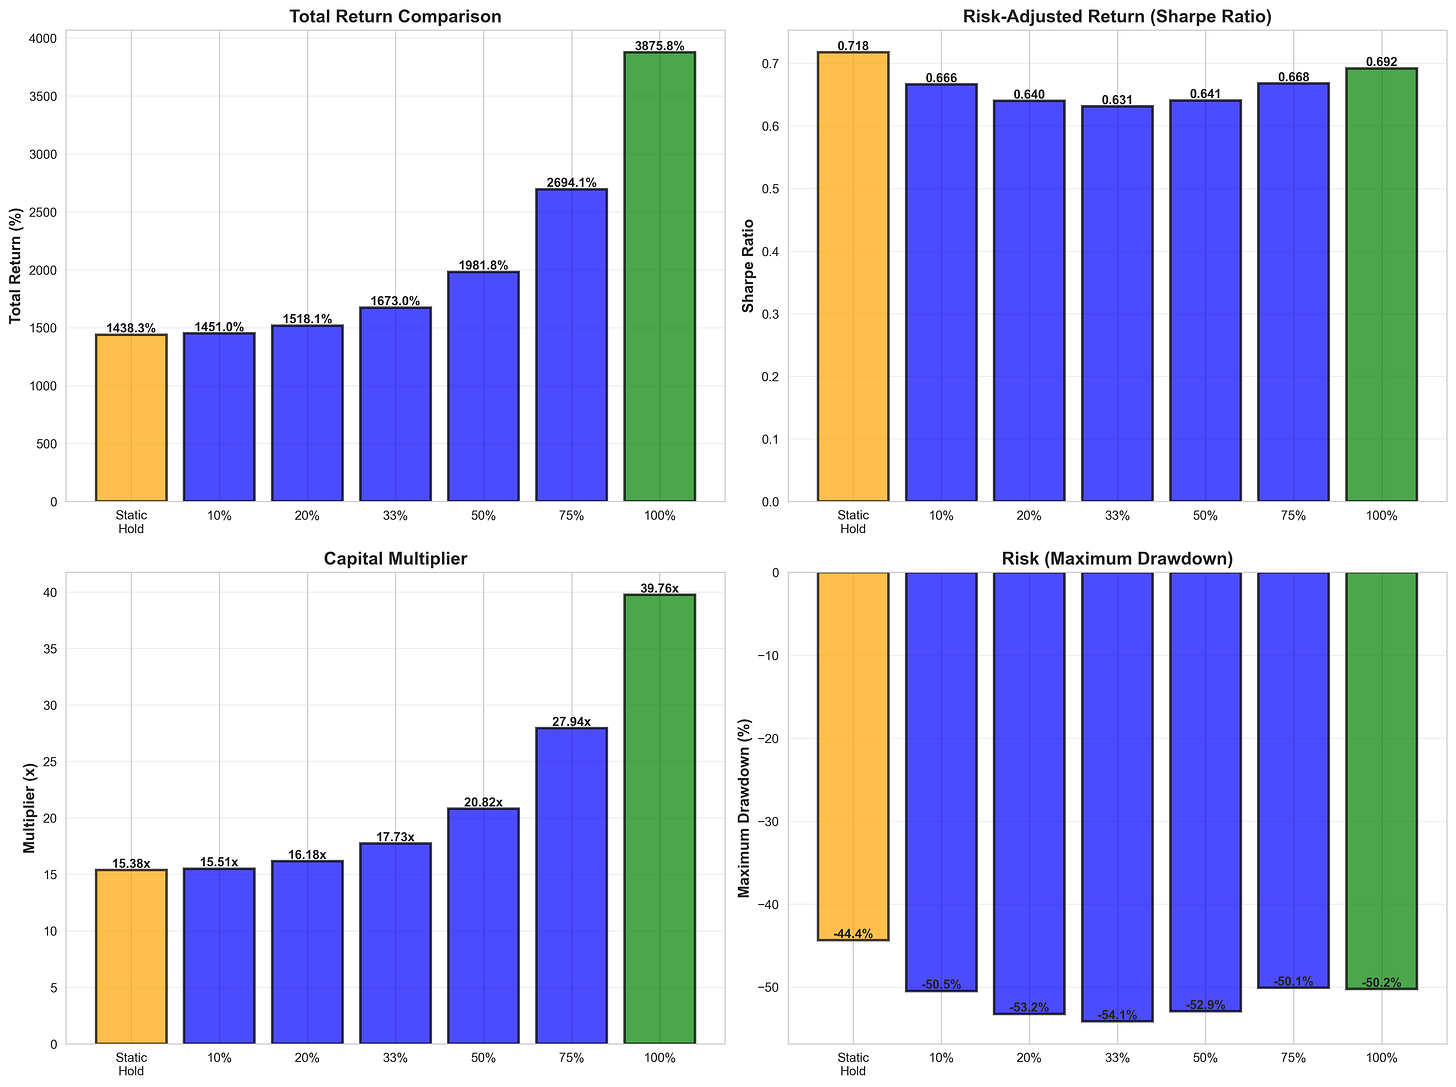
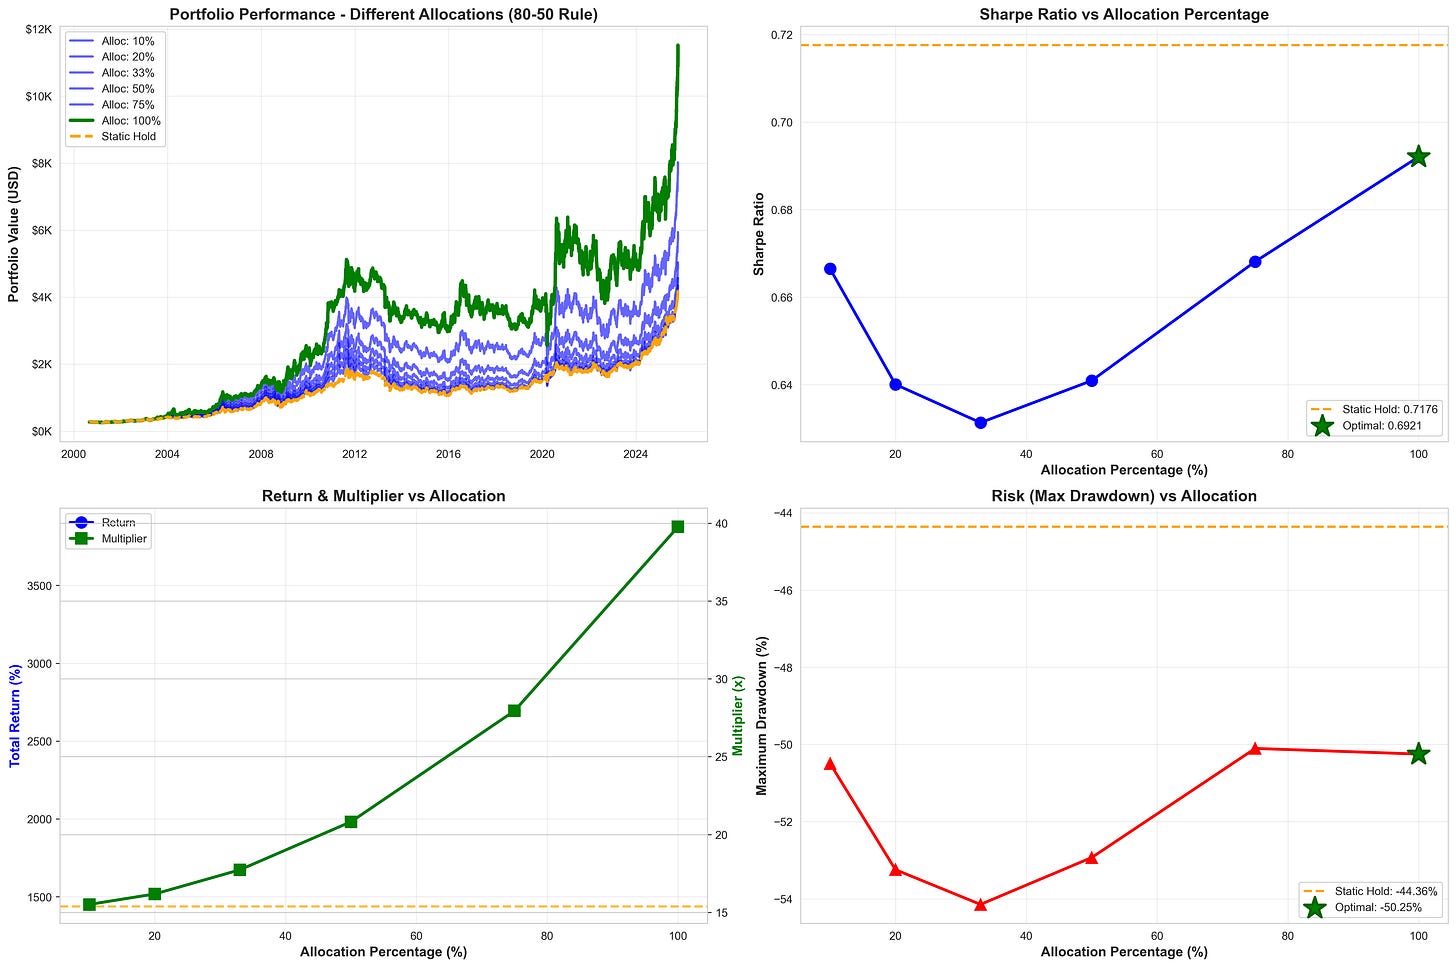
This strategy aims to increase the total ounces of precious metals owned without requiring additional capital investment. The effectiveness stems from the gold-silver ratio's unique property of long-term mean reversion, which distinguishes it from other asset classes like stocks, bonds, real estate, or cryptocurrencies.
Historical Success Examples
This strategy has proven effective during several historical periods, offering significant opportunities to increase total precious metals holdings through market cycles.
Historical Ratio Trade Results
Gold-silver ratio fluctuations show multiple profitable trading opportunities over the past 25 years
Investors who reallocated from gold to silver during the 2008 peak (84:1) captured silver's 400% rally to $49/oz by 2011. Following the 2020 pandemic peak (125.1:1), silver doubled in price within six months, allowing ratio traders to significantly increase their metals positions.
More recent opportunities have included the banking crisis of 2023, where the ratio peaked at 91:1 before declining to 73:1, and the trade tensions of 2024-2025, with the ratio moving from 110:1 to the current 96:1 level.
Current Market Situation (May 2025)
As of May 2025, the gold-silver ratio stands at approximately 99:1, representing a significant change compared to the July 2024 level of 85:1 seen during the height of trade tensions. With gold trading at approximately $3,440 per ounce and silver at $34.80 per ounce (as of May 2025), the ratio's increase to near the 100:1 mark suggests renewed preference for gold's safe-haven status.
Gold and Silver Price Movement (2024-2025)
Gold up 28% and silver up 25% year-to-date, with gold outperforming in recent months
This shift appears connected to increasing geopolitical tensions and uncertainty about global growth prospects. Silver's dual demand structure—serving both as a precious metal and an industrial commodity—creates distinctive market dynamics that can lead to underperformance during phases of economic concern.
Gold Price (May 2025)
Silver Price (May 2025)
Current Ratio
SLV Q1 2025 Outflows
The widening ratio has already influenced investment flows, with the SPDR Gold Trust (GLD) recording inflows of $1.2 billion in the first quarter of 2025, while the iShares Silver Trust (SLV) experienced outflows of $800 million during the same period. This shift in investment patterns aligns with historical ratio expansion cycles and suggests growing investor preference for gold's perceived stability during uncertain economic times.
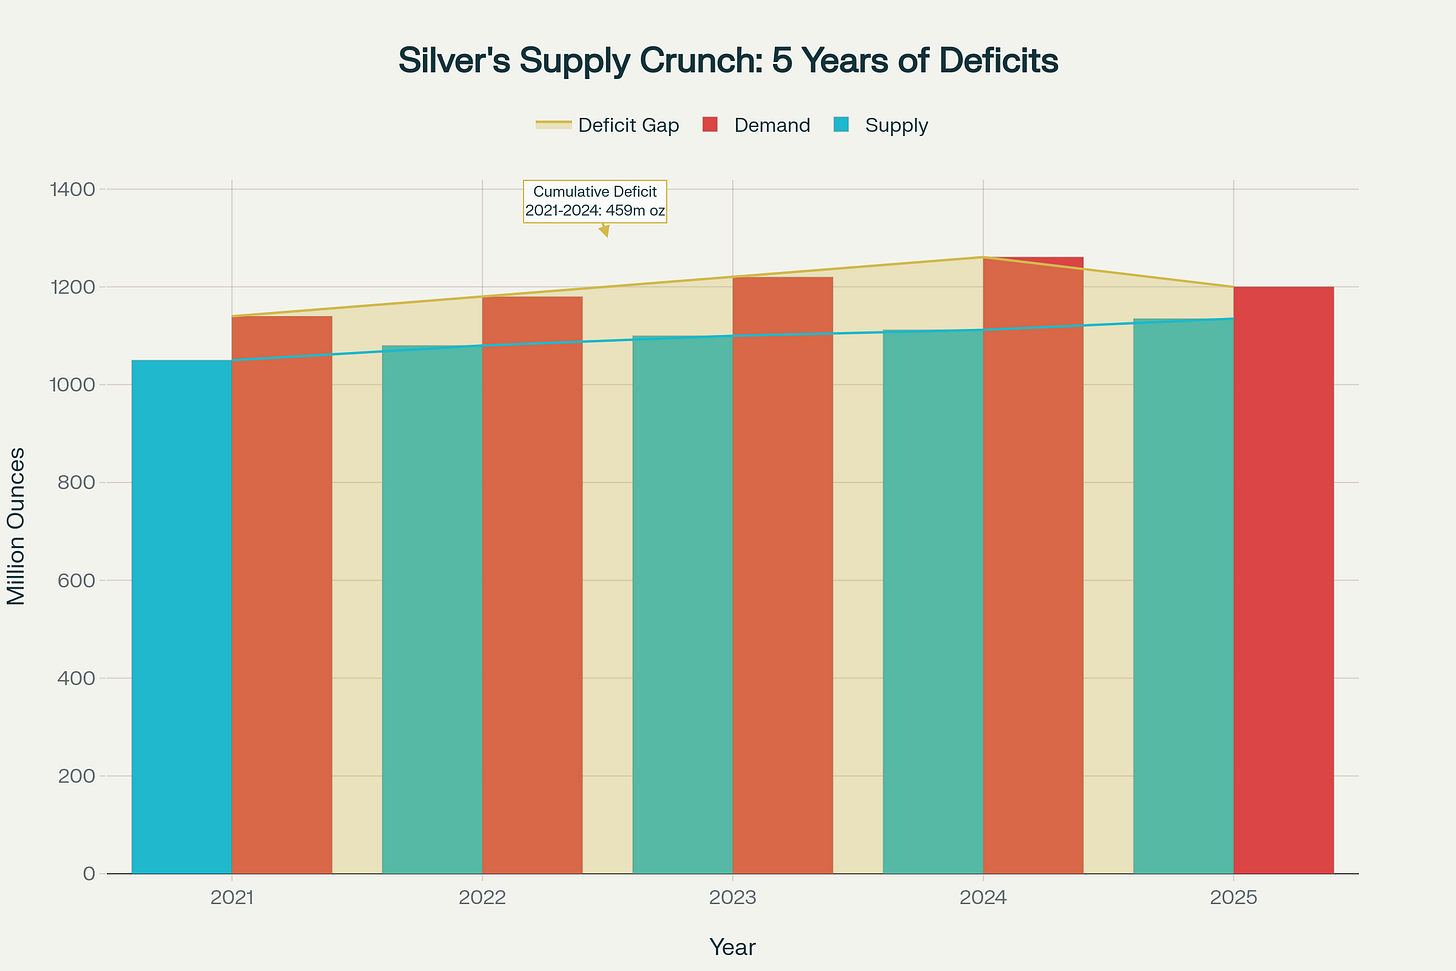
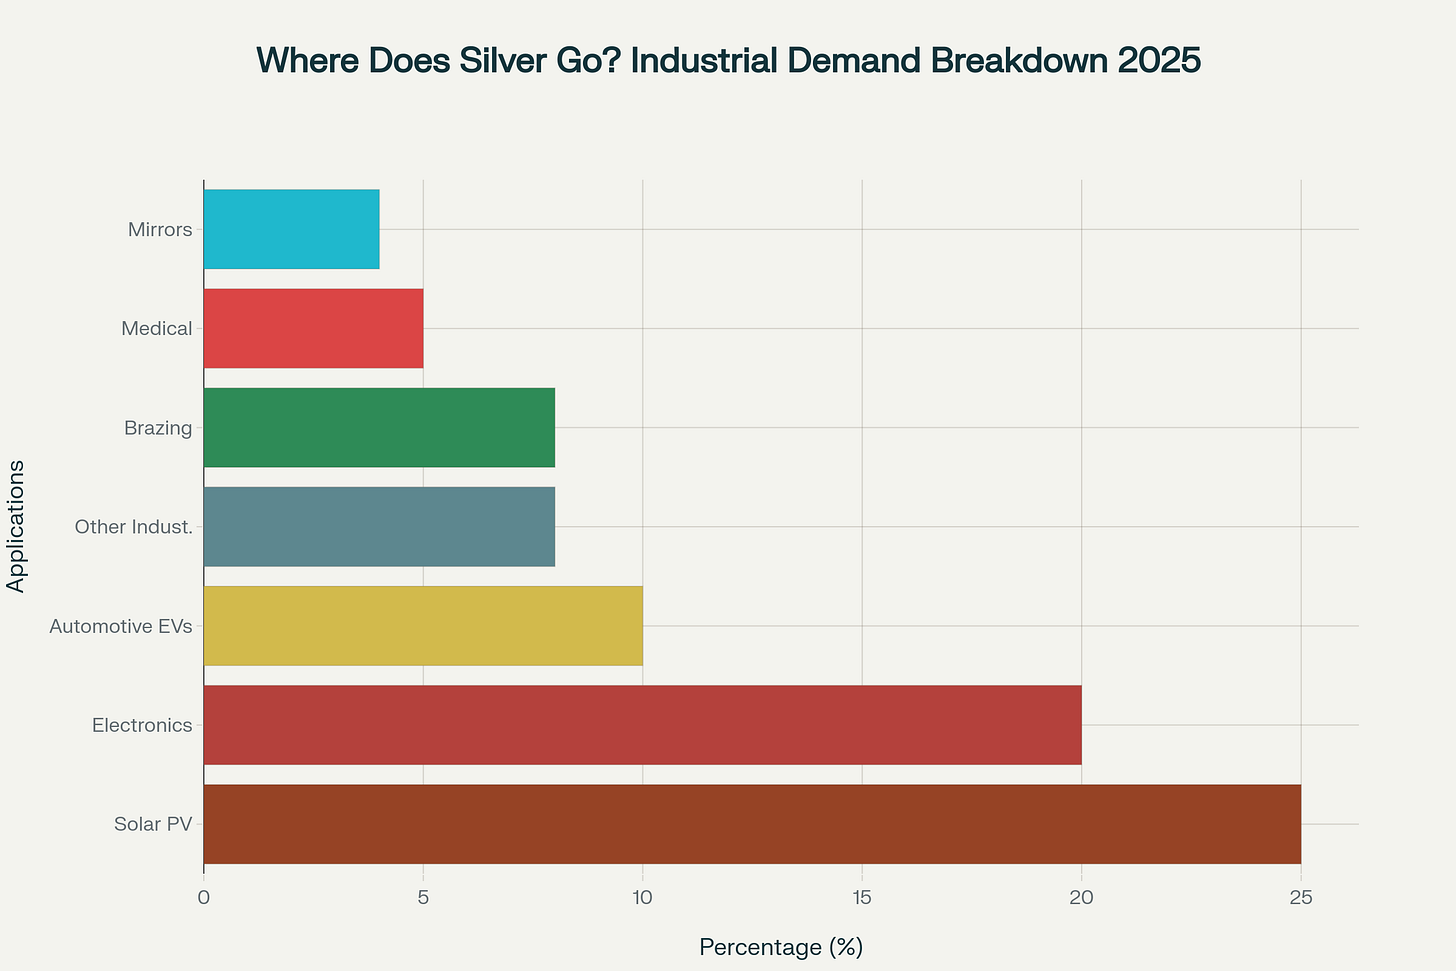
Silver industrial demand remains strong at 680.5 million ounces in 2024, driven by its expanding role in green technologies and electronics. However, this resilient demand has been overshadowed by investment outflows, creating a market structure that has enabled the ratio to expand back toward the psychologically important 100:1 level.
Implications for Investors
The current gold-silver ratio dynamics carry several important implications for investors considering precious metals allocations in 2025.
Signal of Economic Sentiment
The ratio's decline from its recent peak suggests a potential shift toward more optimistic economic sentiment. Historically, falling ratios have corresponded with periods of economic recovery or expansion, benefiting silver through increased industrial demand. Investors should consider this potential economic signal alongside other indicators when making broad portfolio allocation decisions.
Precious Metals Correlations with Other Assets
Silver shows stronger positive correlation with economic growth than gold
Potential for Silver Outperformance
With the ratio still historically elevated despite its recent decline, silver may have significant room for relative outperformance compared to gold. The long-term historical average of approximately 60:1 for the 1900-2020 period suggests the ratio could fall considerably further if reverting toward historical norms.
Silver Outperformance Potential
Silver Price Potential: If the ratio were to compress to the 20th century average of 47:1 while gold remains at $3,440/oz, the implied silver price would be $73.19/oz, representing a 104% increase from current levels.
Trading Opportunity
For active investors who employ ratio trading strategies, the current environment may represent an opportunity to shift some gold holdings to silver, particularly if other indicators support the continuation of the ratio's downward trend. However, this approach requires careful timing and risk management, as short-term volatility can complicate execution.
Investor Considerations
While the current ratio suggests potential silver outperformance, remain aware that ratio movements can be extended and volatile.
Consider implementing a staged approach rather than making a single large reallocation.
Monitor other indicators like inflation trends, industrial production data, and Federal Reserve policy for confirmation of the ratio's direction.
Portfolio Diversification Benefits
The divergent price drivers for gold and silver—with gold more sensitive to monetary policy and geopolitical risks, while silver responds additionally to industrial demand—means holding both metals can provide enhanced portfolio diversification beyond what either metal offers individually.
Even for investors who don't engage in active ratio trading, maintaining balanced exposure to both metals allows for participation in their complementary performance characteristics across different economic scenarios.
Future Outlook: Factors That Will Influence the Ratio
Several key factors will likely influence the gold-silver ratio's trajectory through the remainder of 2025 and beyond.
Central Bank Monetary Policy
The Federal Reserve's interest rate decisions will significantly impact both metals but may affect them differently. Anticipated rate cuts could broadly support both metals as non-yielding assets, but the magnitude of response may differ, influencing the ratio. The release of inflation data and Federal Reserve communications will be closely watched for signals about future monetary policy direction.
Global Economic Growth Trends
Economic growth projections will disproportionately affect silver due to its industrial applications. Stronger growth typically favors silver and pushes the ratio lower, while economic contraction benefits gold and raises the ratio. Recent manufacturing PMI data suggests improving global industrial activity, which could continue to support silver's relative performance.
Trade Relations and Supply Chains
Normalization of global trade relations could boost manufacturing activity and industrial demand for silver. Recent developments in trade negotiations and supply chain reconfiguration will continue to influence silver's industrial demand profile. The potential resolution of trade disputes between major economies could further accelerate this trend in late 2025.
Investment Demand Patterns
Changes in investor sentiment between safe-haven seeking (favoring gold) and growth-oriented investing (benefiting silver) will continue to drive ratio fluctuations. Monitoring ETF flows can provide insights into shifting investor preferences between the metals. Recent outflows from gold ETFs coupled with strong inflows to silver funds suggest this trend may continue.
Technology Sector Developments
Silver's expanding role in technologies like photovoltaics, electric vehicles, and 5G infrastructure means technological advancement and adoption rates will increasingly influence silver demand and potentially the gold-silver ratio over the long term. The accelerating global energy transition is particularly significant, with each gigawatt of solar power requiring approximately 20 tonnes of silver.
2024 Solar Panel Silver Demand
2024 EV Silver Demand
2024 5G/IoT Silver Demand
These technology-driven demand factors are expected to become increasingly significant in determining silver's supply-demand balance, potentially creating structural support for silver prices and contributing to long-term ratio compression.
Conclusion: A Strategic Approach for Precious Metals Investors
The gold-silver ratio represents one of the most valuable tools available to precious metals investors, offering both market timing signals and tactical allocation opportunities. As of May 2025, with the ratio having fallen below 100:1 but still remaining historically elevated, several strategic considerations emerge:
For conservative investors, the current environment suggests maintaining exposure to both metals while perhaps gradually increasing silver allocations to capitalize on potential continued ratio compression. The ratio's decline from 2024 highs indicates a potential broader shift in economic sentiment that could favor silver's industrial applications.
For active traders, the gold-silver ratio's historical tendency toward mean reversion suggests continued opportunities for ratio-based trading strategies. While the extreme peaks of 2020 (125:1) and 2024 (110:1) have subsided, the current level still leaves considerable room for further compression toward long-term averages of 60-70:1.
Perhaps most importantly, investors should recognize that the gold-silver ratio serves not just as a trading tool but as a macroeconomic barometer. Its current trajectory suggests improving industrial demand expectations and potentially shifting inflation dynamics that may have broader implications across investment portfolios.
As we progress through 2025, monitoring the relationship between these two precious metals will continue to provide valuable insights into market sentiment, economic conditions, and potential investment opportunities—making the gold-silver ratio an essential indicator for investors seeking to navigate an increasingly complex financial landscape.
Key Takeaways
- The gold-silver ratio is a powerful market indicator calculated by dividing the price of gold by the price of silver, showing how many ounces of silver it takes to buy one ounce of gold
- Historical data shows the ratio has ranged from as low as 2.5:1 in ancient Egypt to an all-time high of 125:1 during the 2020 COVID-19 pandemic
- A high ratio (above 80:1) typically signals economic uncertainty and risk aversion, while a declining ratio indicates improving economic growth prospects and increased risk appetite
- The ratio trade strategy involves converting between metals at extreme ratio levels, which has historically allowed investors to increase their total precious metals holdings
- As of May 2025, the ratio has declined below 100:1 from its 2024 average of 110:1, suggesting potential silver outperformance and improved economic sentiment
Quick Answers to Common Questions
What is the gold-silver ratio and how is it calculated?
What does a high gold-silver ratio indicate?
What does a declining gold-silver ratio indicate?
How can investors use the gold-silver ratio in their trading strategy?
What is the current gold-silver ratio and what does it mean for investors?
Continue Your Research
Copper-to-Gold Ratio: The Powerful Economic Indicator
Discover how the copper-to-gold ratio provides unique insights into global economic trends, treasury yields, and investment opportunities.
Read moreGold Mining Industry in 2025: Production Challenges & Environmental Impact
Explore the pivotal transition in global gold mining as production peaks in 2025 before entering decline, amid record prices, environmental concerns, and technological innovation.
Read moreInvesting in Physical Gold: A Global, Cost-Effective Guide
Learn how to maximize your gold investment by minimizing premiums, choosing the right bullion, and leveraging regional tax advantages across the US, Europe, Middle East, Turkey, and India.
Read moreGold vs. Bitcoin: The Ultimate Battle for Sound Money Supremacy
Explore the fascinating debate between traditional gold and digital Bitcoin as competing stores of value in our uncertain economic landscape.
Read more