
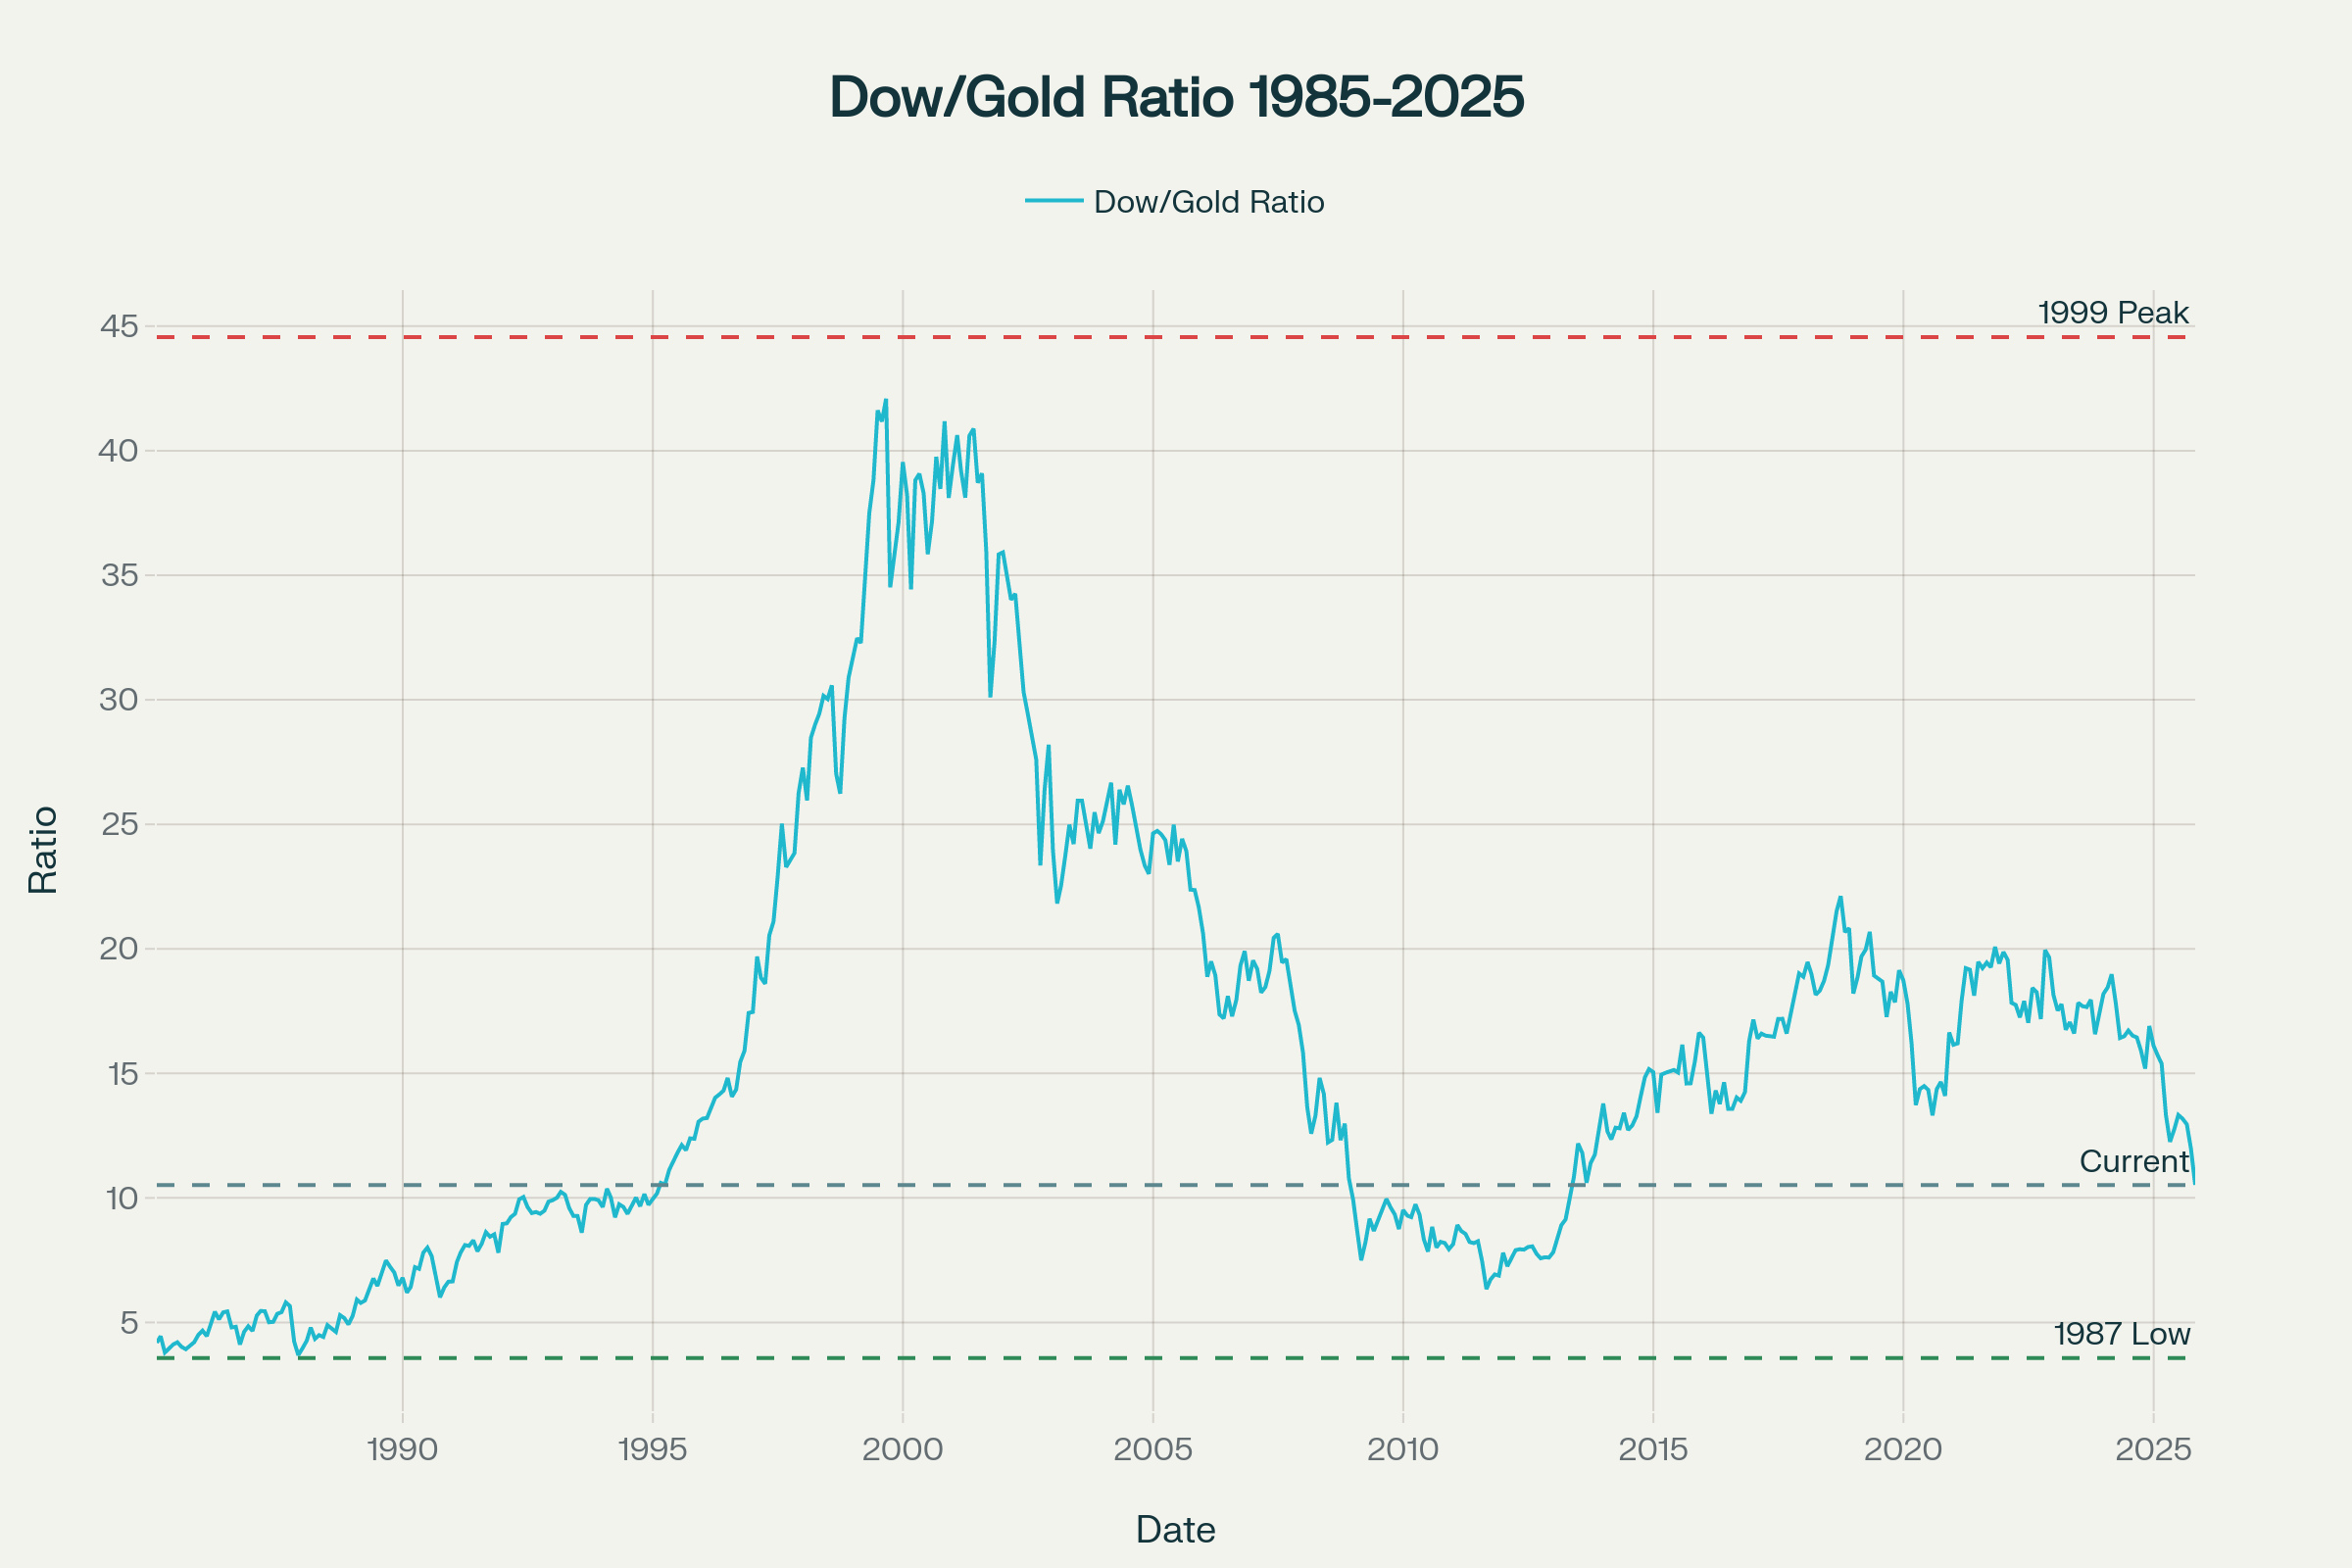
The Dow Jones to Gold ratio just hit 10.52—and if history is any guide, we’re witnessing something remarkable. This deceptively simple metric, which measures how many ounces of gold it takes to “buy” the Dow Jones Industrial Average, has quietly become one of the most reliable long-term market indicators of the past century. And right now, it’s telling a story that most investors are missing.
While the financial media celebrates new stock market highs and $4,000+ gold simultaneously, this ratio reveals the uncomfortable truth: stocks have lost nearly 75% of their value relative to gold since 1999, despite nominal gains. We’re not just seeing a gold rally—we’re witnessing a fundamental shift in how the world values paper assets versus real money.
The Ratio That Predicted Every Major Market Turn
The Dow/Gold ratio isn’t just another technical indicator—it’s a century-spanning barometer of investor confidence in paper assets. When the ratio is high, it signals that investors believe in economic growth, corporate profits, and the stability of fiat currencies. When it’s low, it suggests the opposite: economic uncertainty, currency debasement, and a flight to tangible assets.
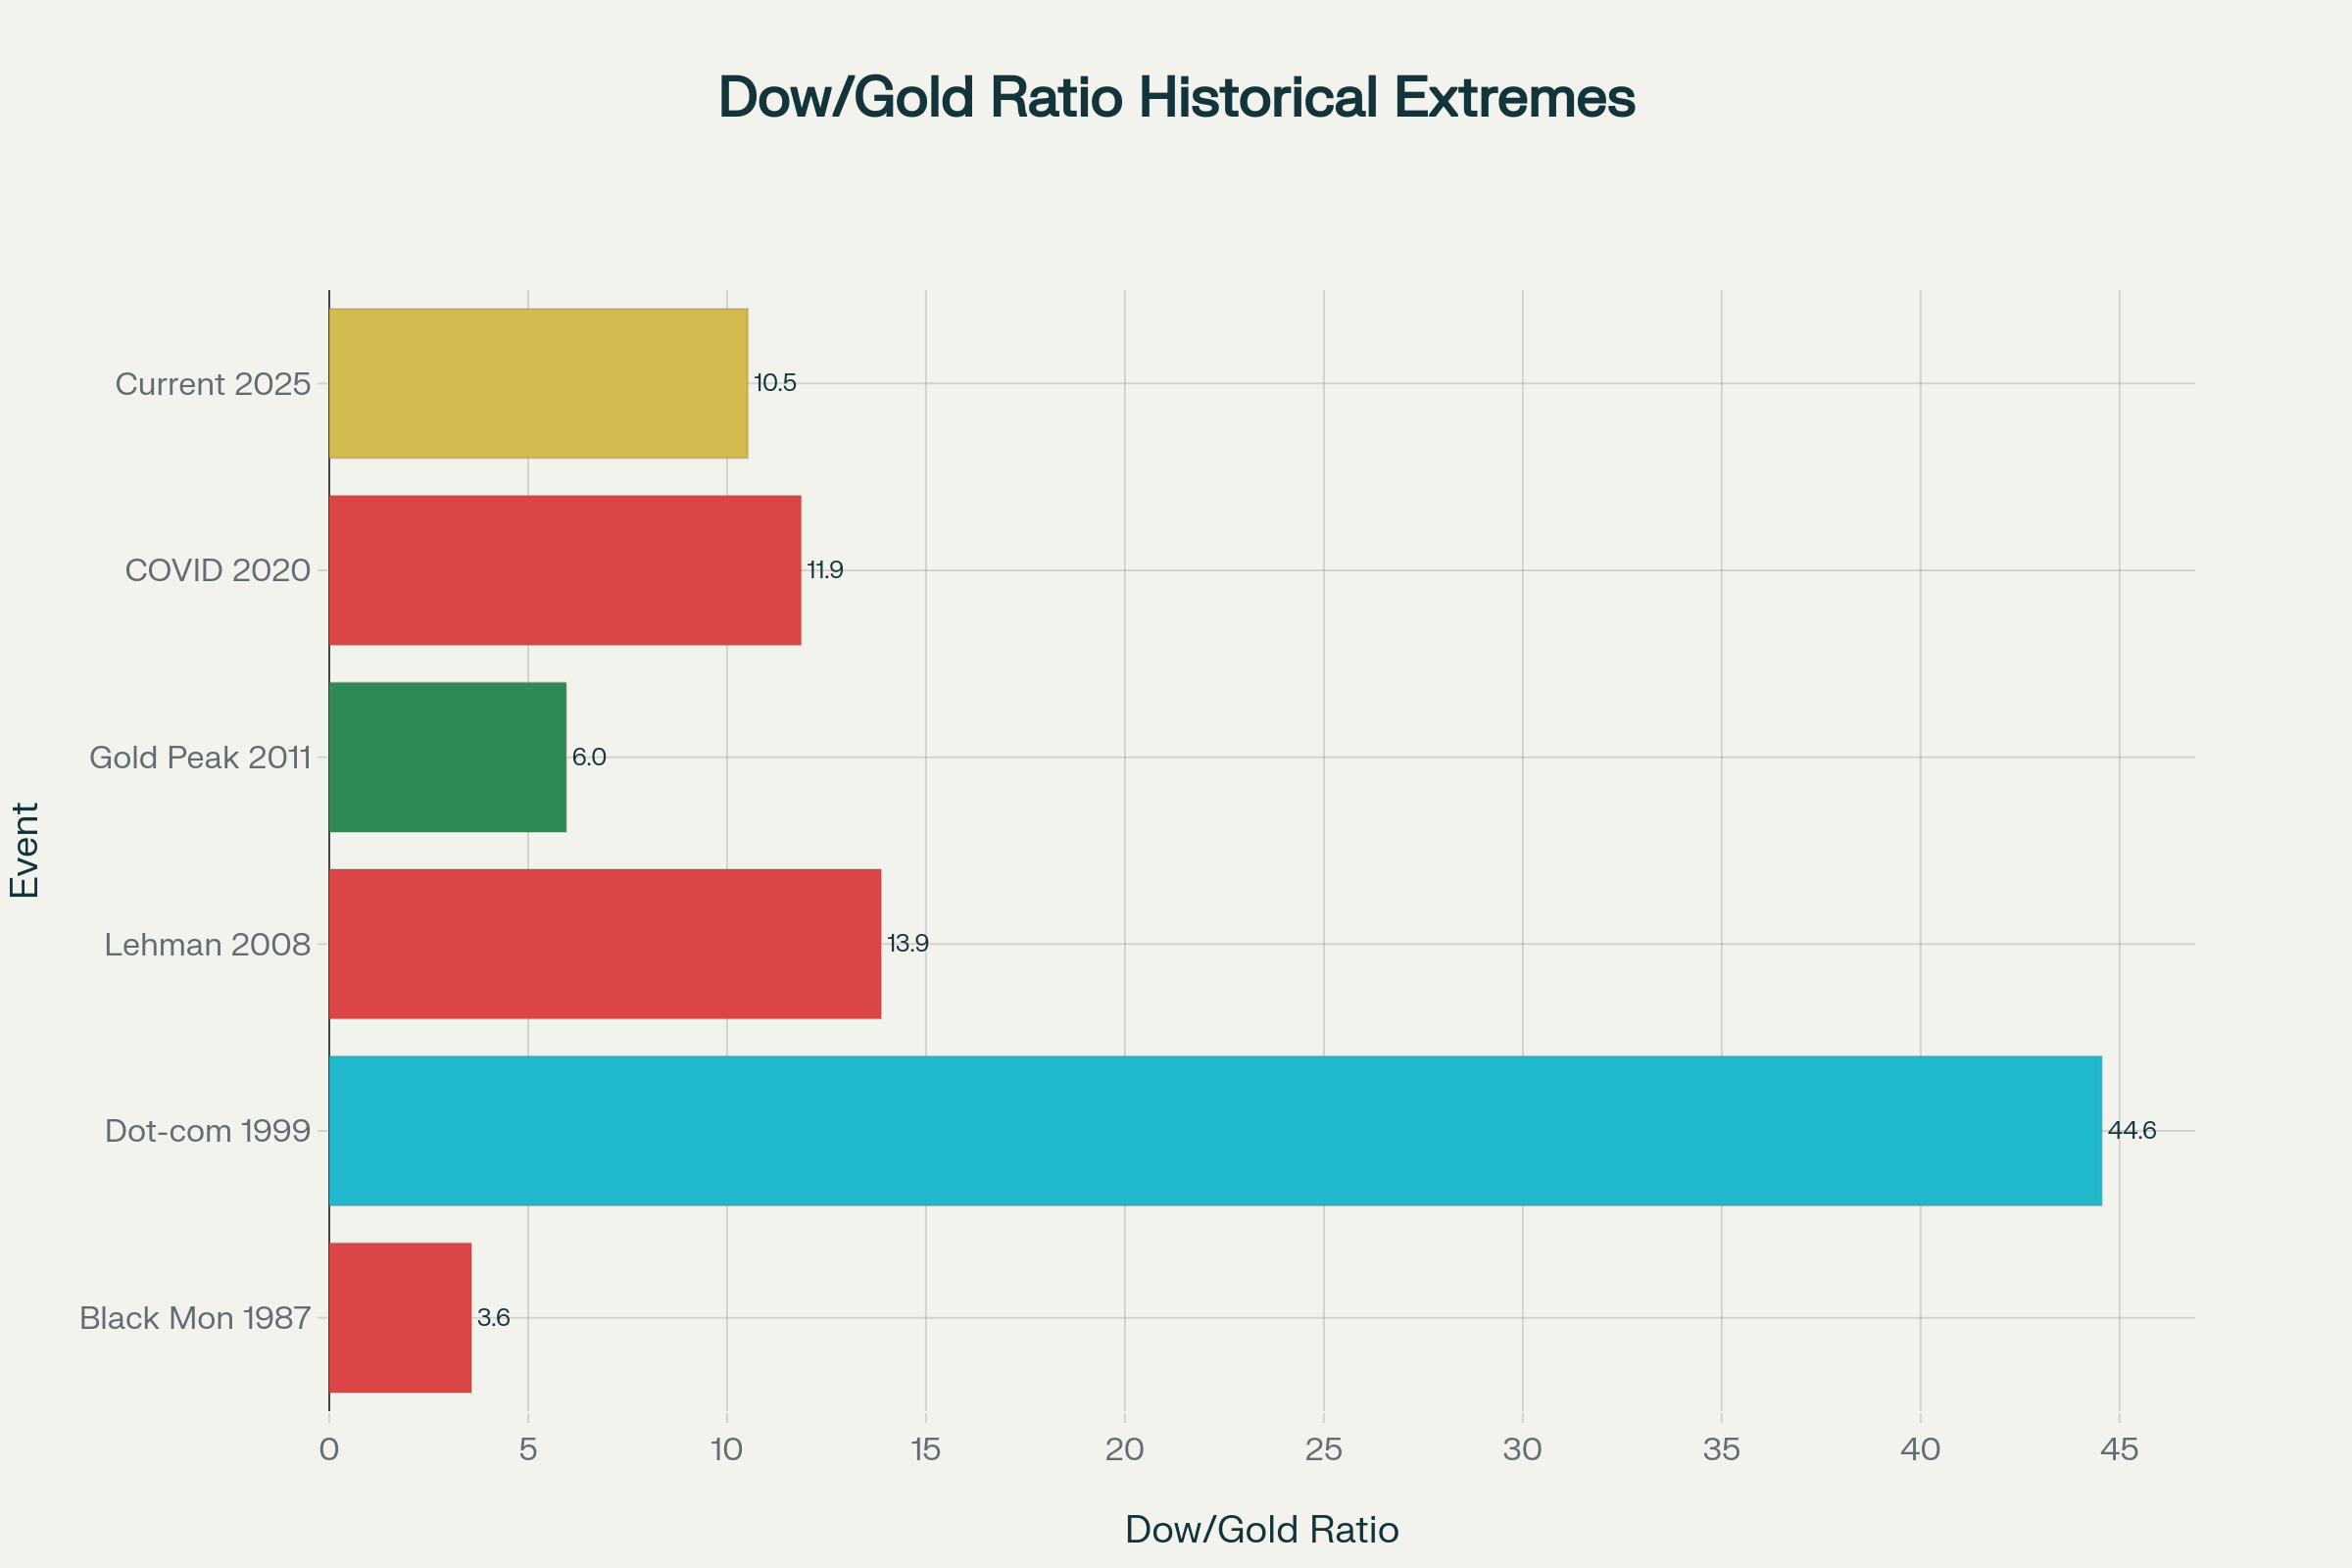
The historical extremes tell the story:
1929: Ratio hit 18.6 just before the Great Depression
1999: Peaked at an unprecedented 44.6 during the dot-com bubble
1980: Bottomed at 1.0 during the stagflation crisis
2011: Hit 5.96 after the financial crisis
Today: Sitting at 10.52, approaching multi-decade lows
What makes the current reading so significant isn’t just the level—it’s the context. Previous times when gold outperformed stocks this dramatically coincided with major economic crises or bear markets. But today, gold has surged 65% in the past year while stocks have gained 8%, even as markets reach new highs. This hasn’t happened in over 50 years.
The Dollar’s Silent Crisis
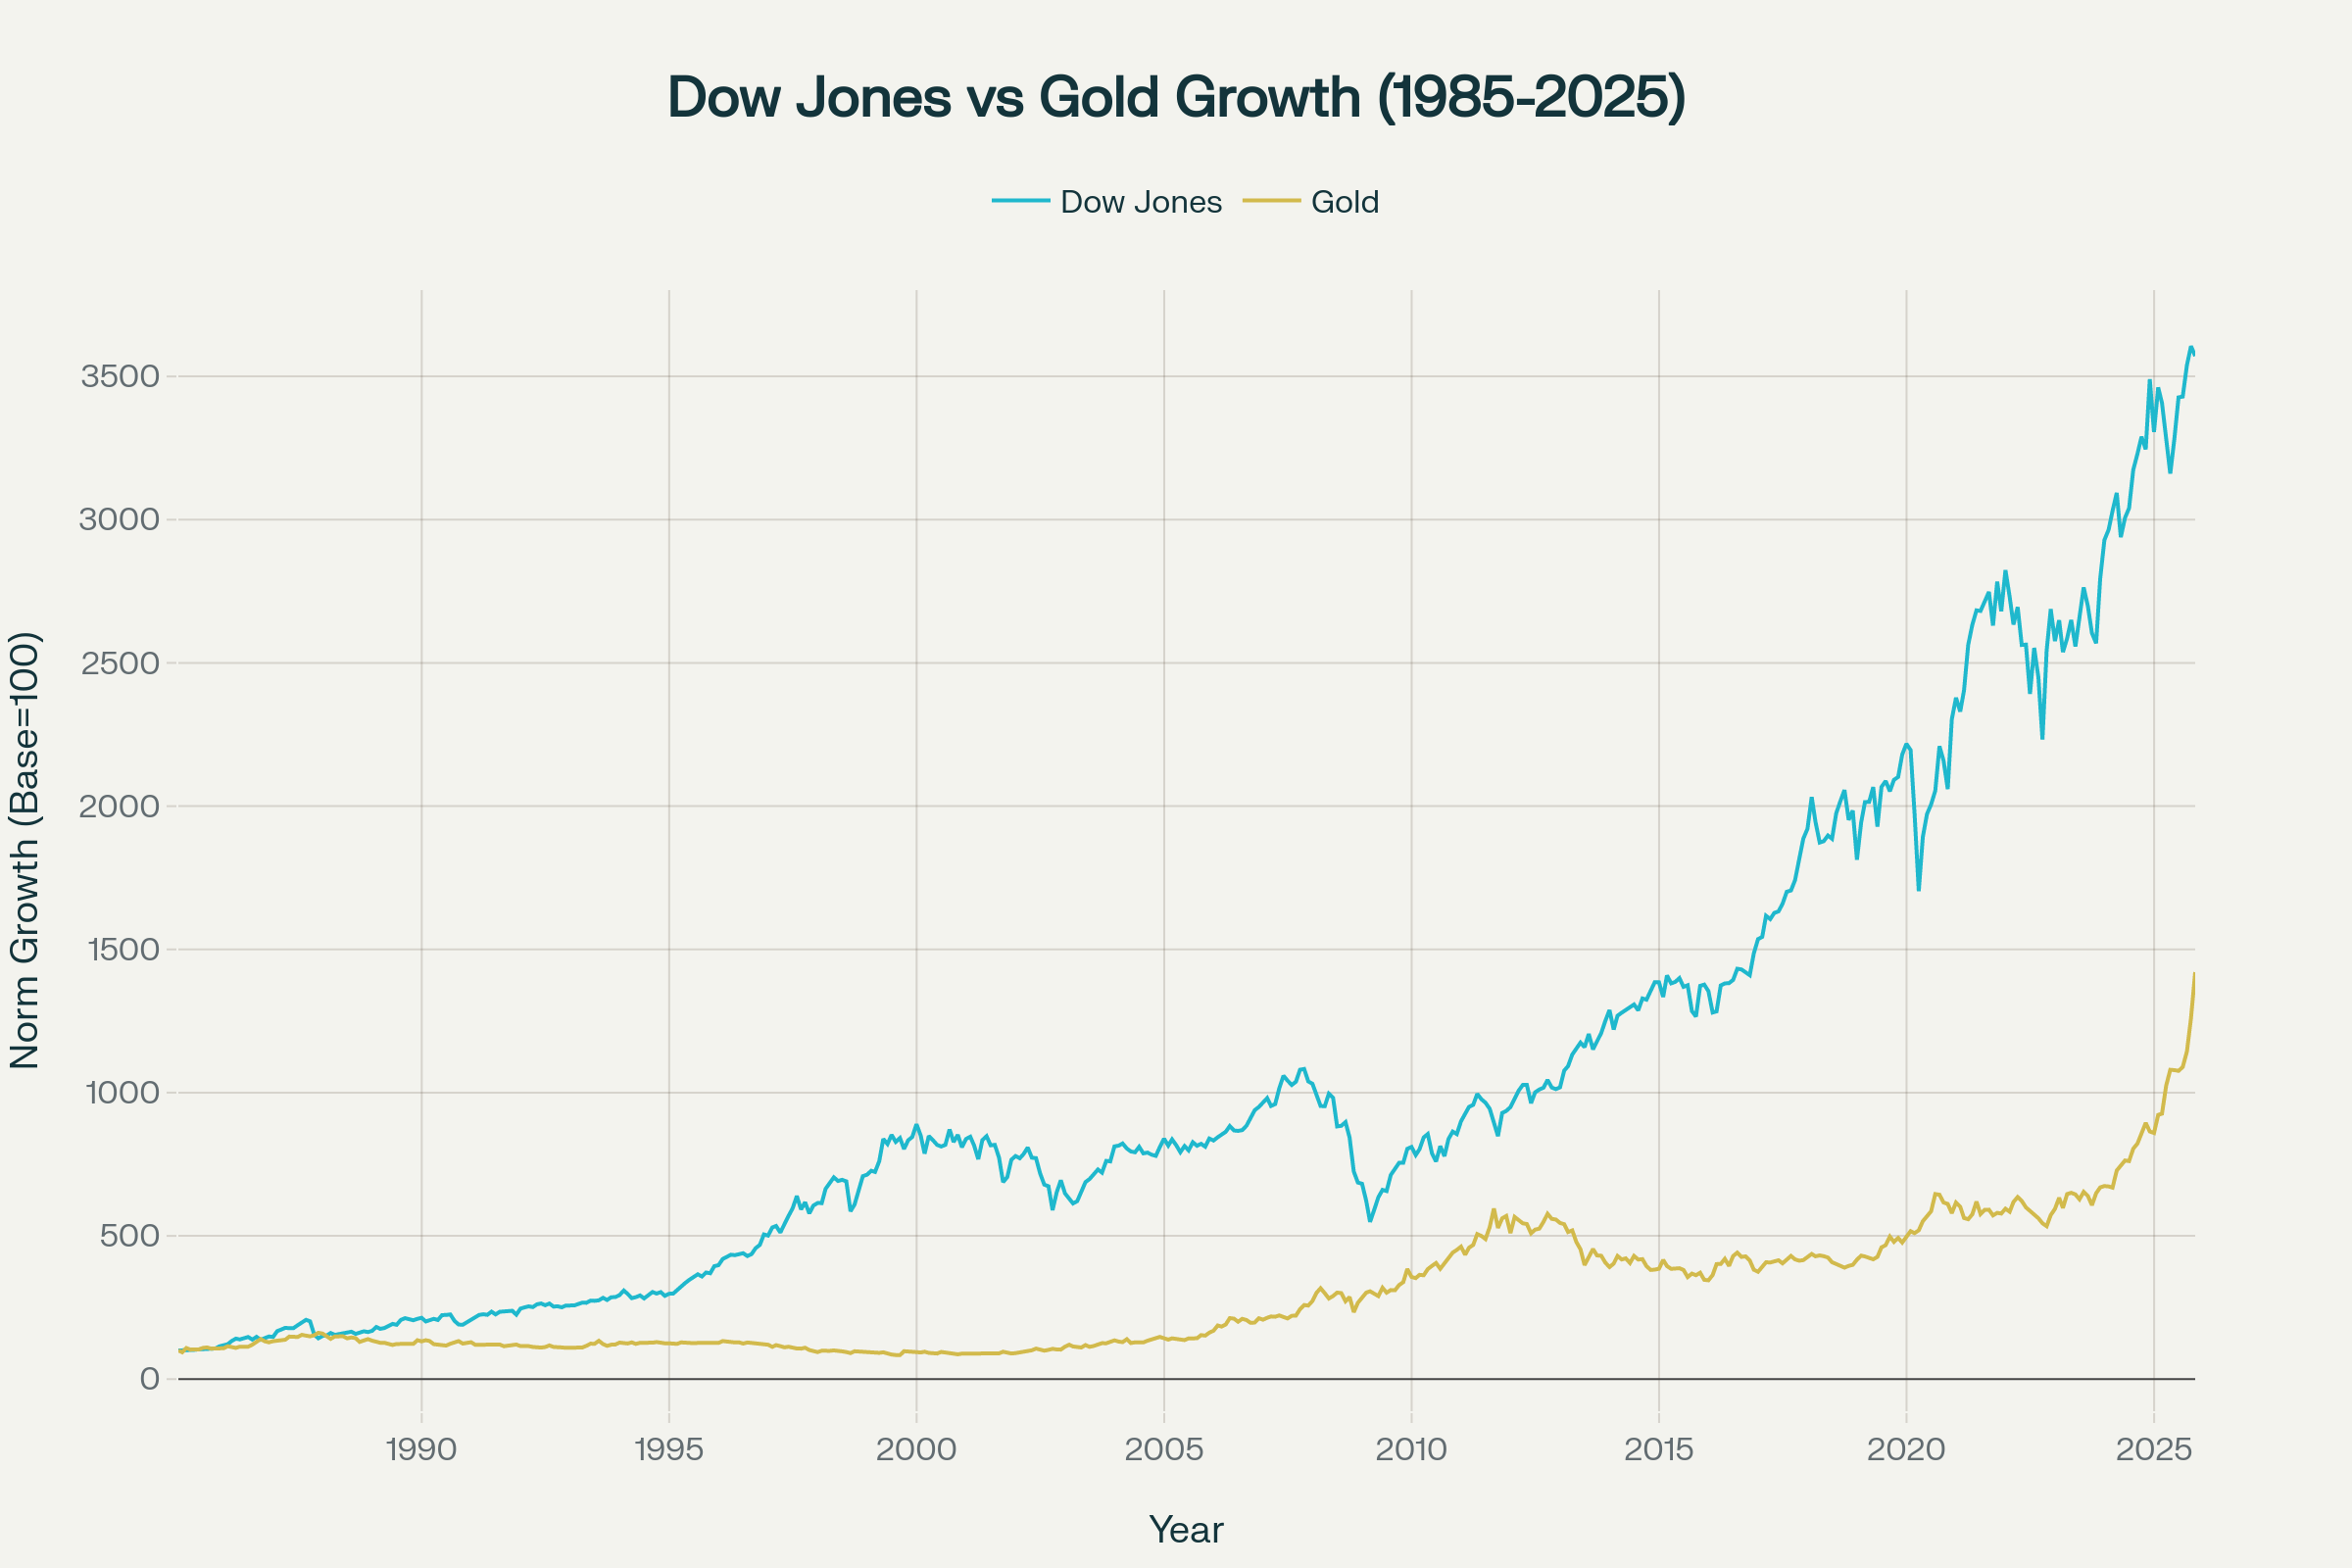
Behind this ratio lies a more fundamental story: the gradual erosion of the dollar’s purchasing power. While the Dow has quadrupled since 1999 in nominal terms, gold has increased fifteenfold, representing a 72% decline in stocks’ real purchasing power.
This isn’t just academic—it reflects a profound shift in global monetary confidence. Central banks worldwide have been accumulating gold at the fastest pace since the 1970s, while the U.S. runs unprecedented fiscal deficits. The ratio’s decline from 45 in 1999 to 10.5 today mirrors the dollar’s loss of over 90% of its value when priced in gold over the same period.
Current market conditions are creating what analysts call a “perfect storm” for continued gold outperformance:
Persistent inflation running above central bank targets
Escalating geopolitical tensions driving safe-haven demand
Record-high stock market valuations with the Buffett Indicator at 217%
Growing concerns about U.S. fiscal sustainability
What History Suggests Happens Next
The Dow/Gold ratio moves in long cycles, typically lasting 15-20 years in each direction. If the current down-cycle that began in 1999 follows historical patterns, we could see the ratio fall to 1-2, similar to the 1980 low.
This doesn’t necessarily mean stock prices will collapse in nominal terms—though they might. More likely, it suggests gold will continue dramatically outperforming stocks as it did from 1999-2011, when the ratio fell 87%. Even if stocks rise 50% from here, gold could double or triple and still drive the ratio lower.
The implications are profound:
Portfolio diversification: Traditional 60/40 stock/bond portfolios may prove inadequate in an environment of persistent inflation and currency debasement
Wealth preservation: Assets tied to fiat currencies face ongoing purchasing power erosion
Investment opportunity: Precious metals and mining stocks have shown 86% gains year-to-date, massively outperforming equities
The Bottom Line for Investors
The Dow/Gold ratio’s current level of 10.52 places us at a critical juncture. Every time this ratio has approached these levels in the past century, it has marked the end of one financial era and the beginning of another. The 1929 peak preceded the Great Depression. The 1966 high marked the start of the stagflation decade. The 1999 extreme launched the “lost decade” for stocks.
Today’s reading suggests we may be in the early stages of another such transition—one where real assets outperform financial assets, where gold reclaims its monetary role, and where the decades-long faith in ever-rising stock prices gets tested by economic reality.
The ratio doesn’t predict when this transition will accelerate, but history suggests it’s not a matter of if, but when. For investors, the question isn’t whether to acknowledge this shift, but how much of their wealth they’re willing to bet that this time is different.
The views expressed are for informational purposes only and should not be considered investment advice. Past performance does not guarantee future results.