
Executive Summary
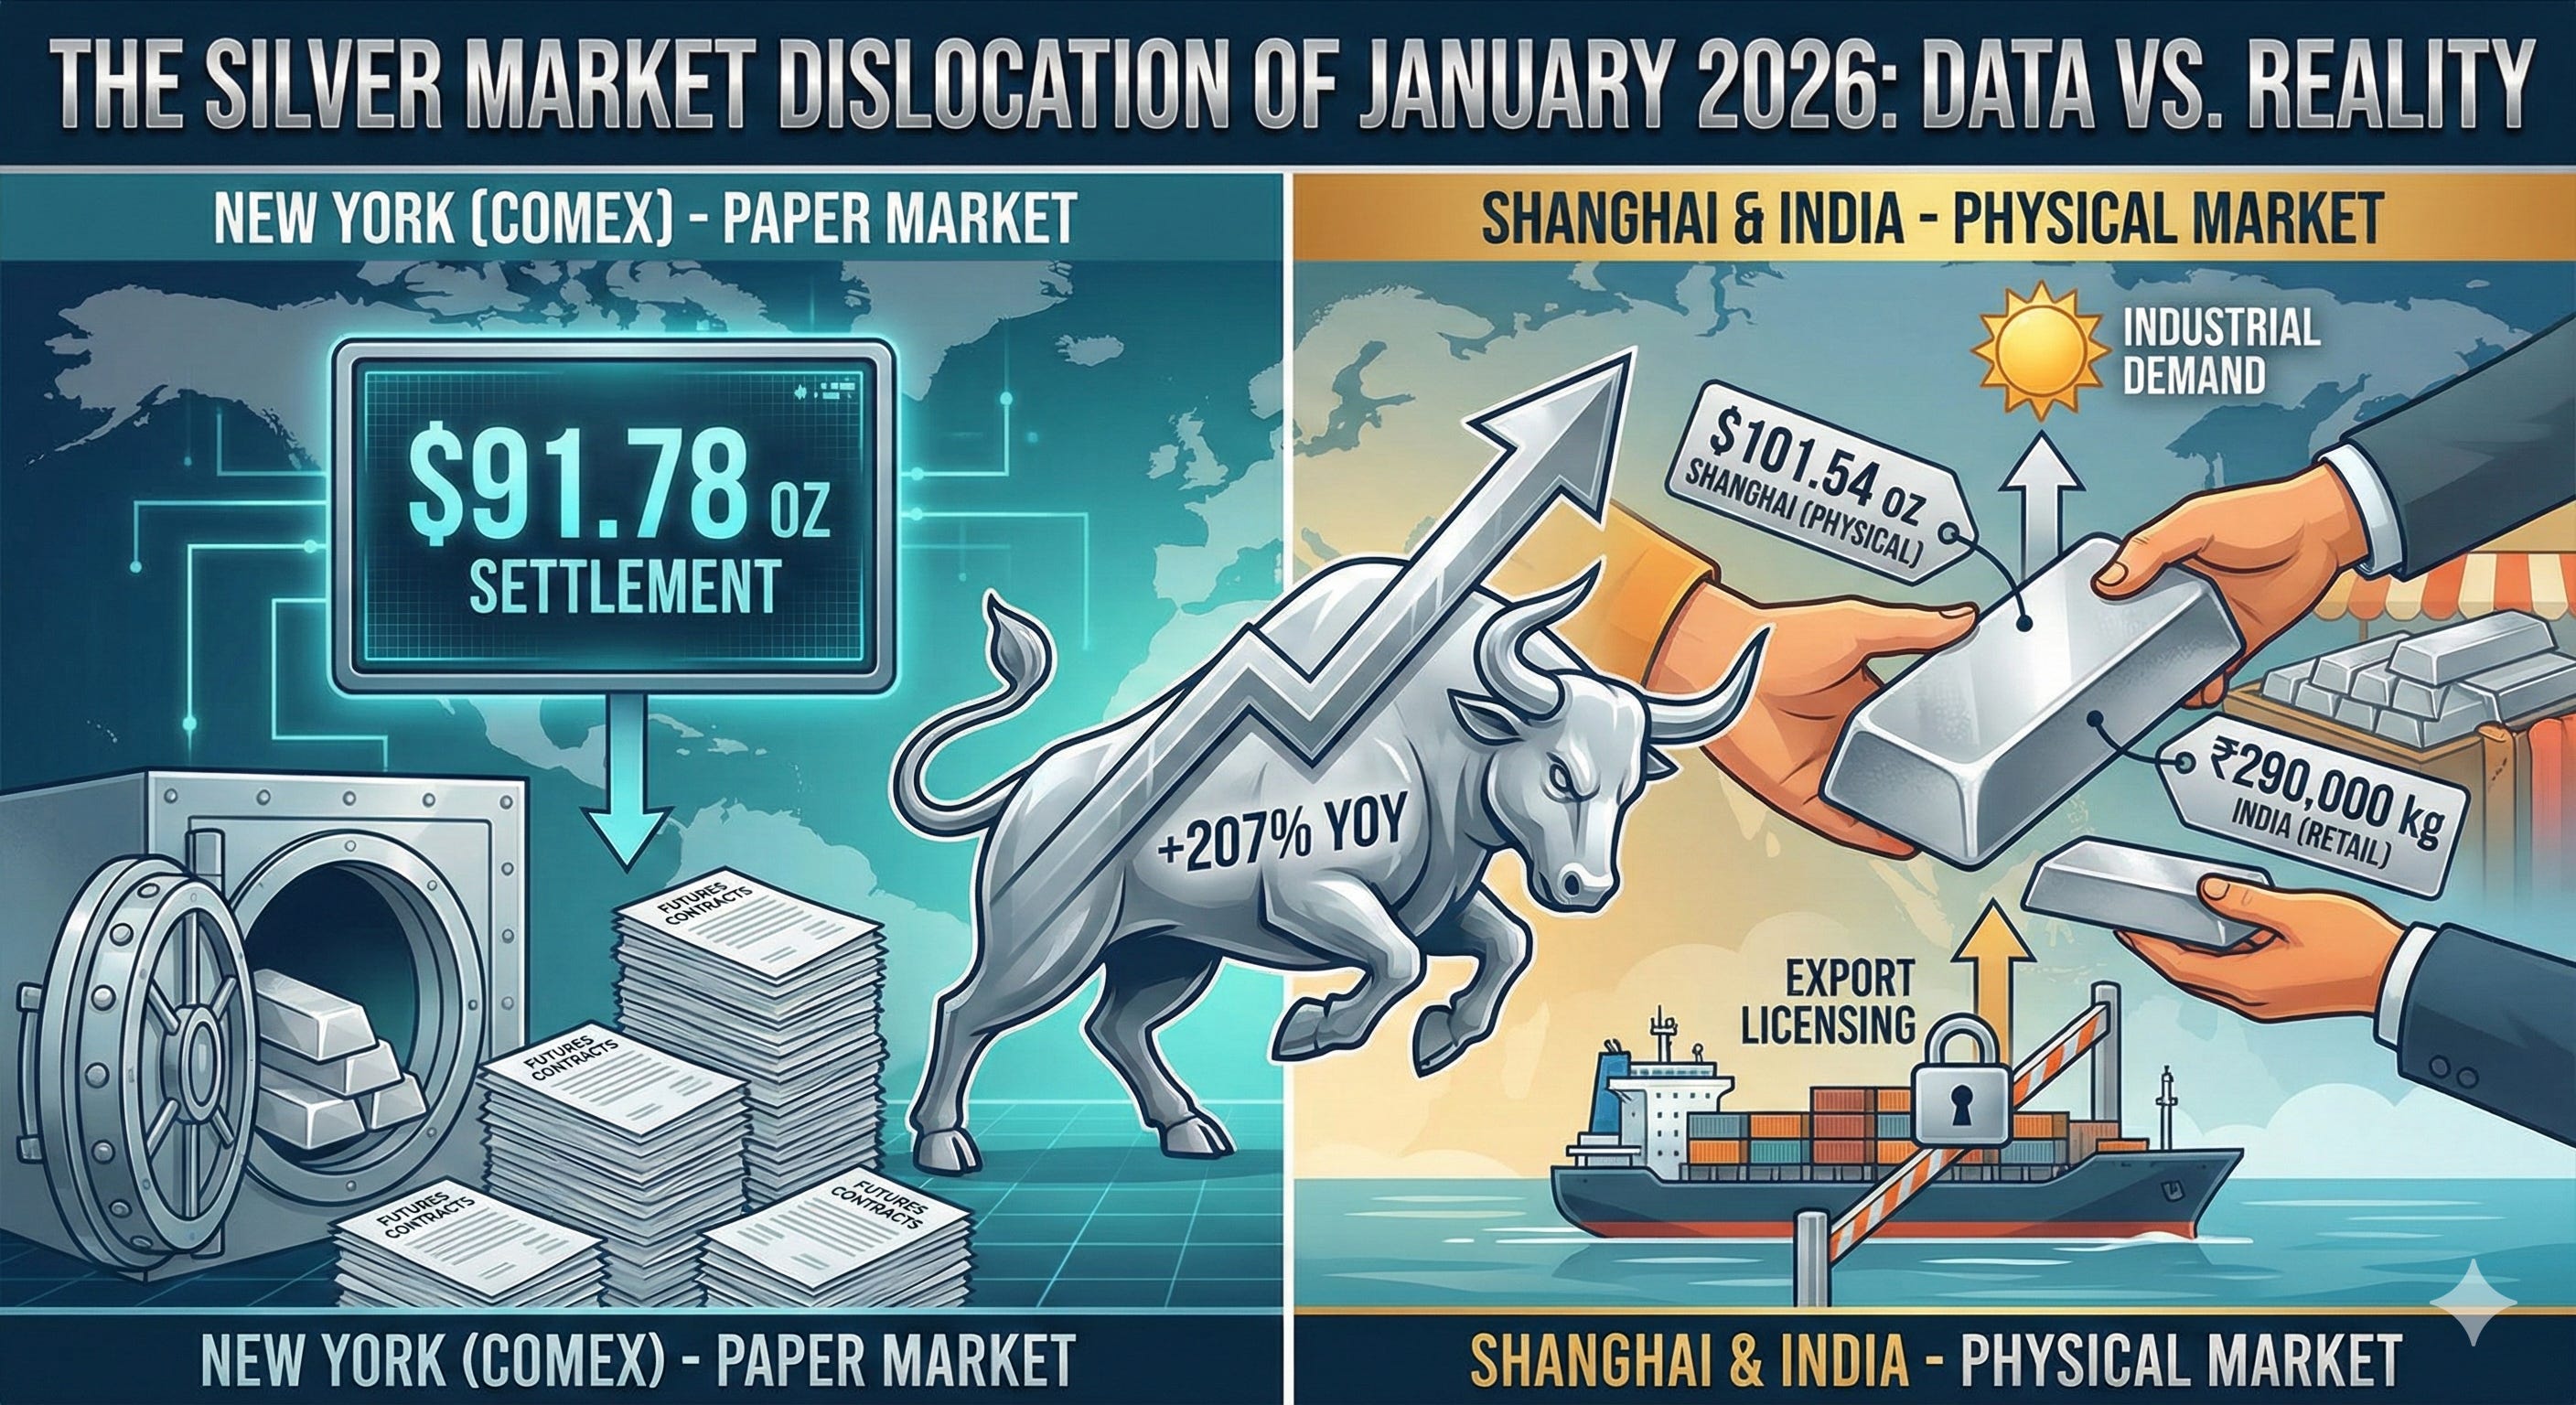
On January 14, 2026, the global silver market experienced a significant price dislocation across its three major trading centers—New York, Shanghai, and India.
While the COMEX settled at $91.78 per ounce, Shanghai physical markets traded at approximately $101.54/oz, and Indian retail markets saw prices reach ₹290,000 per kilogram (approximately $99.82/oz).
This divergence has sparked intense debate. This analysis examines the verified data behind these price movements, the structural causes of the premiums, and what they indicate about the health of the global silver market.
The Verified Price Data
To understand the current market state, we must first look at the confirmed closing numbers from January 14, 2026.
The Price Spread:
COMEX (New York): $91.78 / oz (Official Settlement)
Shanghai Physical: $101.54 / oz (Shanghai Metal Market)
India Retail: ~$99.82 / oz (Converted from ₹290,000/kg)
The Year-Over-Year Context: The acceleration in silver prices is historic when viewed through a 12-month lens.
January 2025: $29.90 / oz
January 2026: $91.78 / oz
Performance: +207% Gain
This represents the strongest year-over-year performance since the 2011 bull market.
Why the Markets Are “Disconnecting”
While headlines often suggest a broken market, the data shows a pattern of regional premiums rather than a systemic failure. The markets are generally converging, but local factors are driving prices higher in Asia.
The $10.04 premium in Shanghai (trading at $101.54) is currently driven by five specific factors:
Transportation Friction: Moving physical silver from New York to Shanghai currently costs $2-4 per ounce due to logistics.
Export Licensing: New export protocols in China (effective Jan 1, 2026) have slowed arbitrage flows, keeping local metal trapped and expensive.
Industrial Demand: China’s solar and electronics sectors are paying premiums to secure immediate delivery.
Currency Basis: The strength of the Yuan relative to the Dollar impacts the local converted price.
Local Stock-outs: Immediate physical availability is tighter in Shanghai than in New York vaults.
The New Margin Requirements
The CME Group recently updated margin requirements for silver futures. While often misinterpreted as an attempt to “crush” a rally, the change was a structural update to handle current price levels.
The exchange shifted from a fixed dollar-amount system to a 9% notional value system.
How it works: At a price of $91.78, the initial margin is now approximately $41,301 per contract ($91.78 × 5,000 oz × 9%).
This adjustment ensures the exchange remains solvent during high volatility. Notably, the market absorbed this change and silver prices continued to hold the $90 level, indicating strong underlying support despite higher leverage costs.
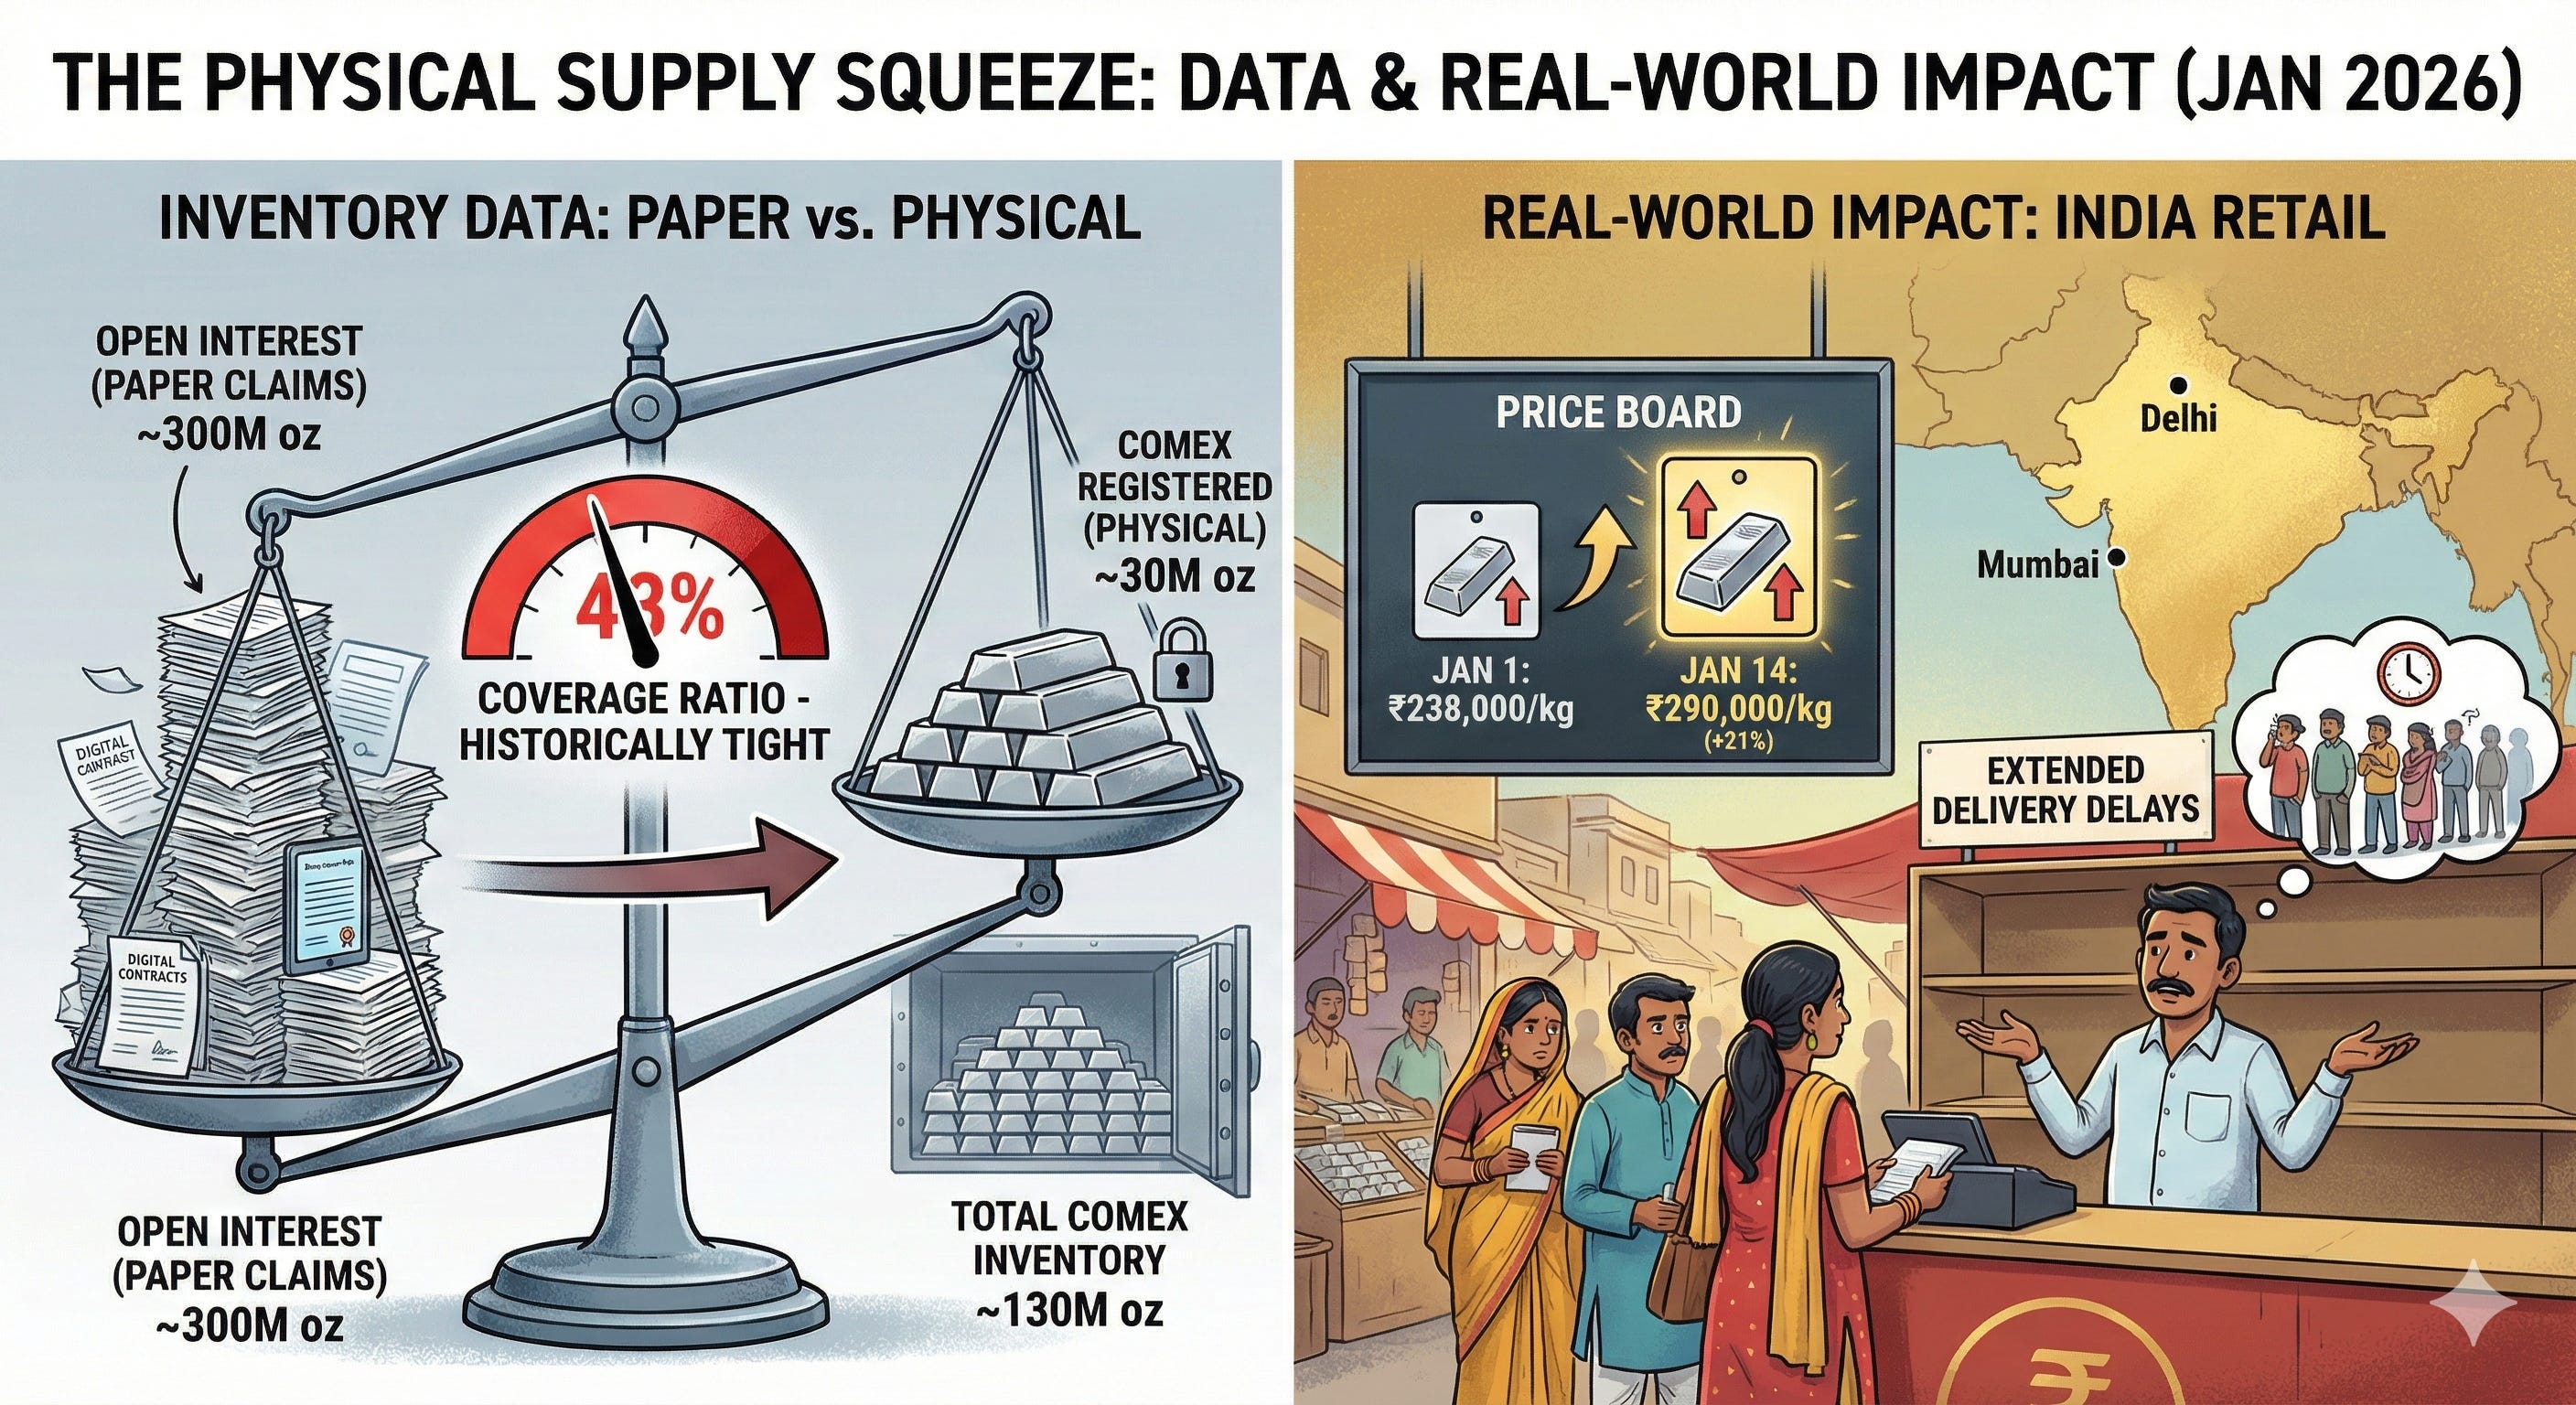
The Physical Supply Squeeze
The most critical data point currently is the ratio of physical inventory to paper claims.
The Inventory Data (Mid-January 2026):
COMEX Registered: ~30 million ounces
Total COMEX Inventory: ~130 million ounces
Open Interest: ~300 million ounces (paper claims)
This creates a coverage ratio of roughly 43%. While futures markets always operate on fractional reserves, this is a historically tight spread.
The Real-World Impact: We are seeing the effects of this tightness most clearly in India. Retail prices there jumped from ₹238,000/kg on Jan 1 to ₹290,000/kg on Jan 14—a 21% increase in two weeks. Major dealers in Mumbai and Delhi are reporting extended delivery delays, confirming that physical metal is becoming harder to source in quantity.
The Macro Shift: Flight to Hard Assets
The silver rally is not happening in a vacuum. We are witnessing a broader rotation of capital into “hard assets” globally.
Gold: Trading near $4,636/oz.
Treasuries: 10-Year Yields rising to 4.5%+ (indicating bond selling).
Bitcoin: Holding above $90,000.
This correlation suggests investors are hedging against inflation and currency debasement simultaneously. Silver is benefiting from both its role as a monetary metal and its critical industrial usage.
Investment Implications
Given the volatility and the premiums, here is a balanced assessment for investors:
For Physical Owners The case for holding remains solid. Supply/demand imbalances and industrial necessity provide a floor for prices. However, with a 207% gain in one year, volatility will be extreme.
For ETF Investors Standard ETFs (like SLV) track the spot price, not the physical premium price. If you own these, you are exposed to the COMEX price ($91.78), not the Shanghai price ($101.54). Be aware of this tracking difference.
For New Buyers With Indian retail premiums hitting 8-12% over spot, patience is key. Dollar-cost averaging is safer than chasing a vertical rally. The “Fear of Missing Out” (FOMO) is high right now, but markets rarely move in a straight line forever.
Conclusion
The data confirms we are in a powerful bull market driven by real fundamentals: industrial demand is up, physical inventories are down, and regional premiums are widening.
However, a “market dislocation” is not the same as a “market collapse.” The financial plumbing is stressed, but functioning. The opportunity in silver is real, but it requires navigating high volatility and understanding that the price you see on a screen may differ from the price you pay for physical metal.
Disclaimer: This article is for informational purposes only and does not constitute financial advice. Market data is accurate as of January 14, 2026.