
If you’ve been stacking gold and silver, you’ve probably heard whispers about “the ratio.” Maybe you’ve seen it hit crazy numbers during COVID-19, or watched silver bugs argue about when it’ll “mean revert.” But here’s the thing: the gold-silver ratio isn’t just trader talk, it’s one of the oldest financial metrics on Earth, and right now, it’s flashing signals that every coin stacker should understand.
Let’s break down what this ratio actually means, what history teaches us, and how you can use it to make smarter decisions about your stack.

What Is the Gold-Silver Ratio Anyway?
The math is dead simple: take the price of one ounce of gold, divide it by the price of one ounce of silver. That’s your ratio.
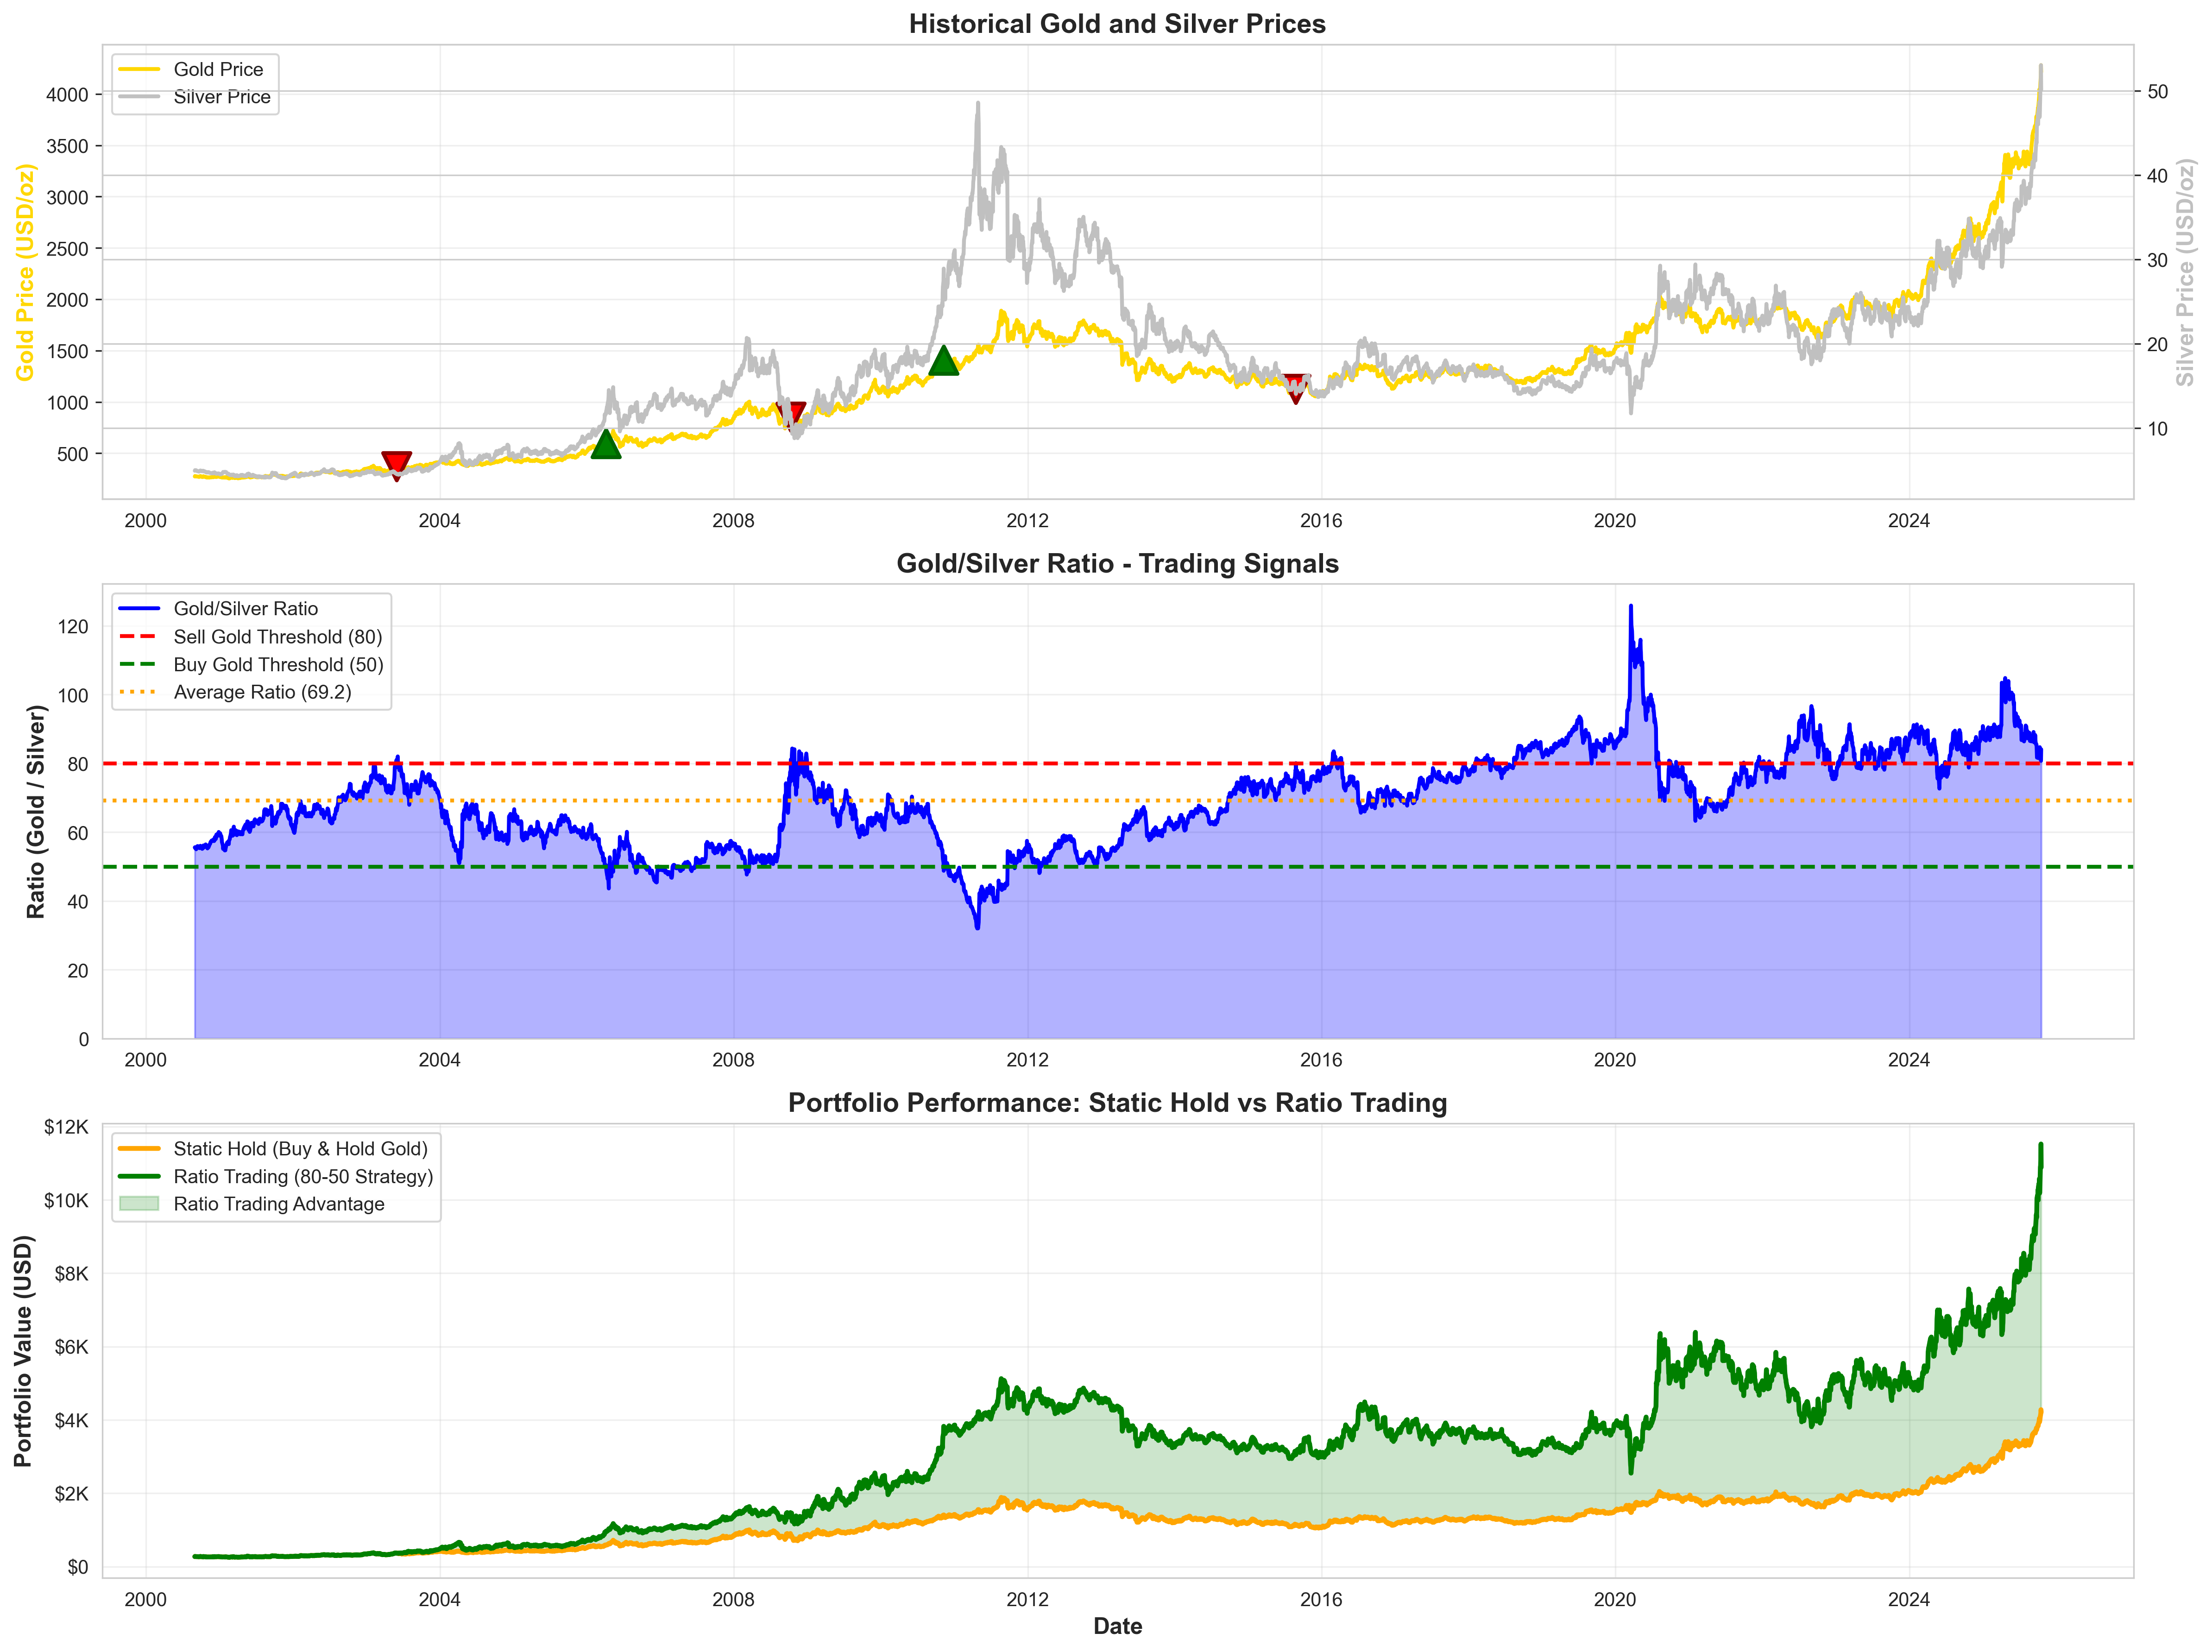
As of October 2025, with gold around $4,250/oz and silver at $53/oz, the ratio sits at about 80:1. This means you need 80 ounces of silver to buy one ounce of gold.
But here’s where it gets interesting: this number has swung wildly throughout history, and those swings create opportunities.
A Quick Trip Through History
The gold-silver ratio has been tracked for over 5,000 years—making it possibly the oldest continuously monitored exchange rate in existence.
Ancient Rome pegged it around 12:1. When the U.S. passed the Coinage Act of 1792, they set it at 15:1. For centuries, governments tried to fix this ratio because both metals were actual money.
But once we left the gold standard, the ratio went wild. In 1980, during the Hunt Brothers’ silver squeeze, it crashed to just 14:1—the lowest modern reading. By 1991, it had shot up to 94:1. During the COVID-19 panic in March 2020, it exploded to an all-time high of 125:1 as investors fled to gold.
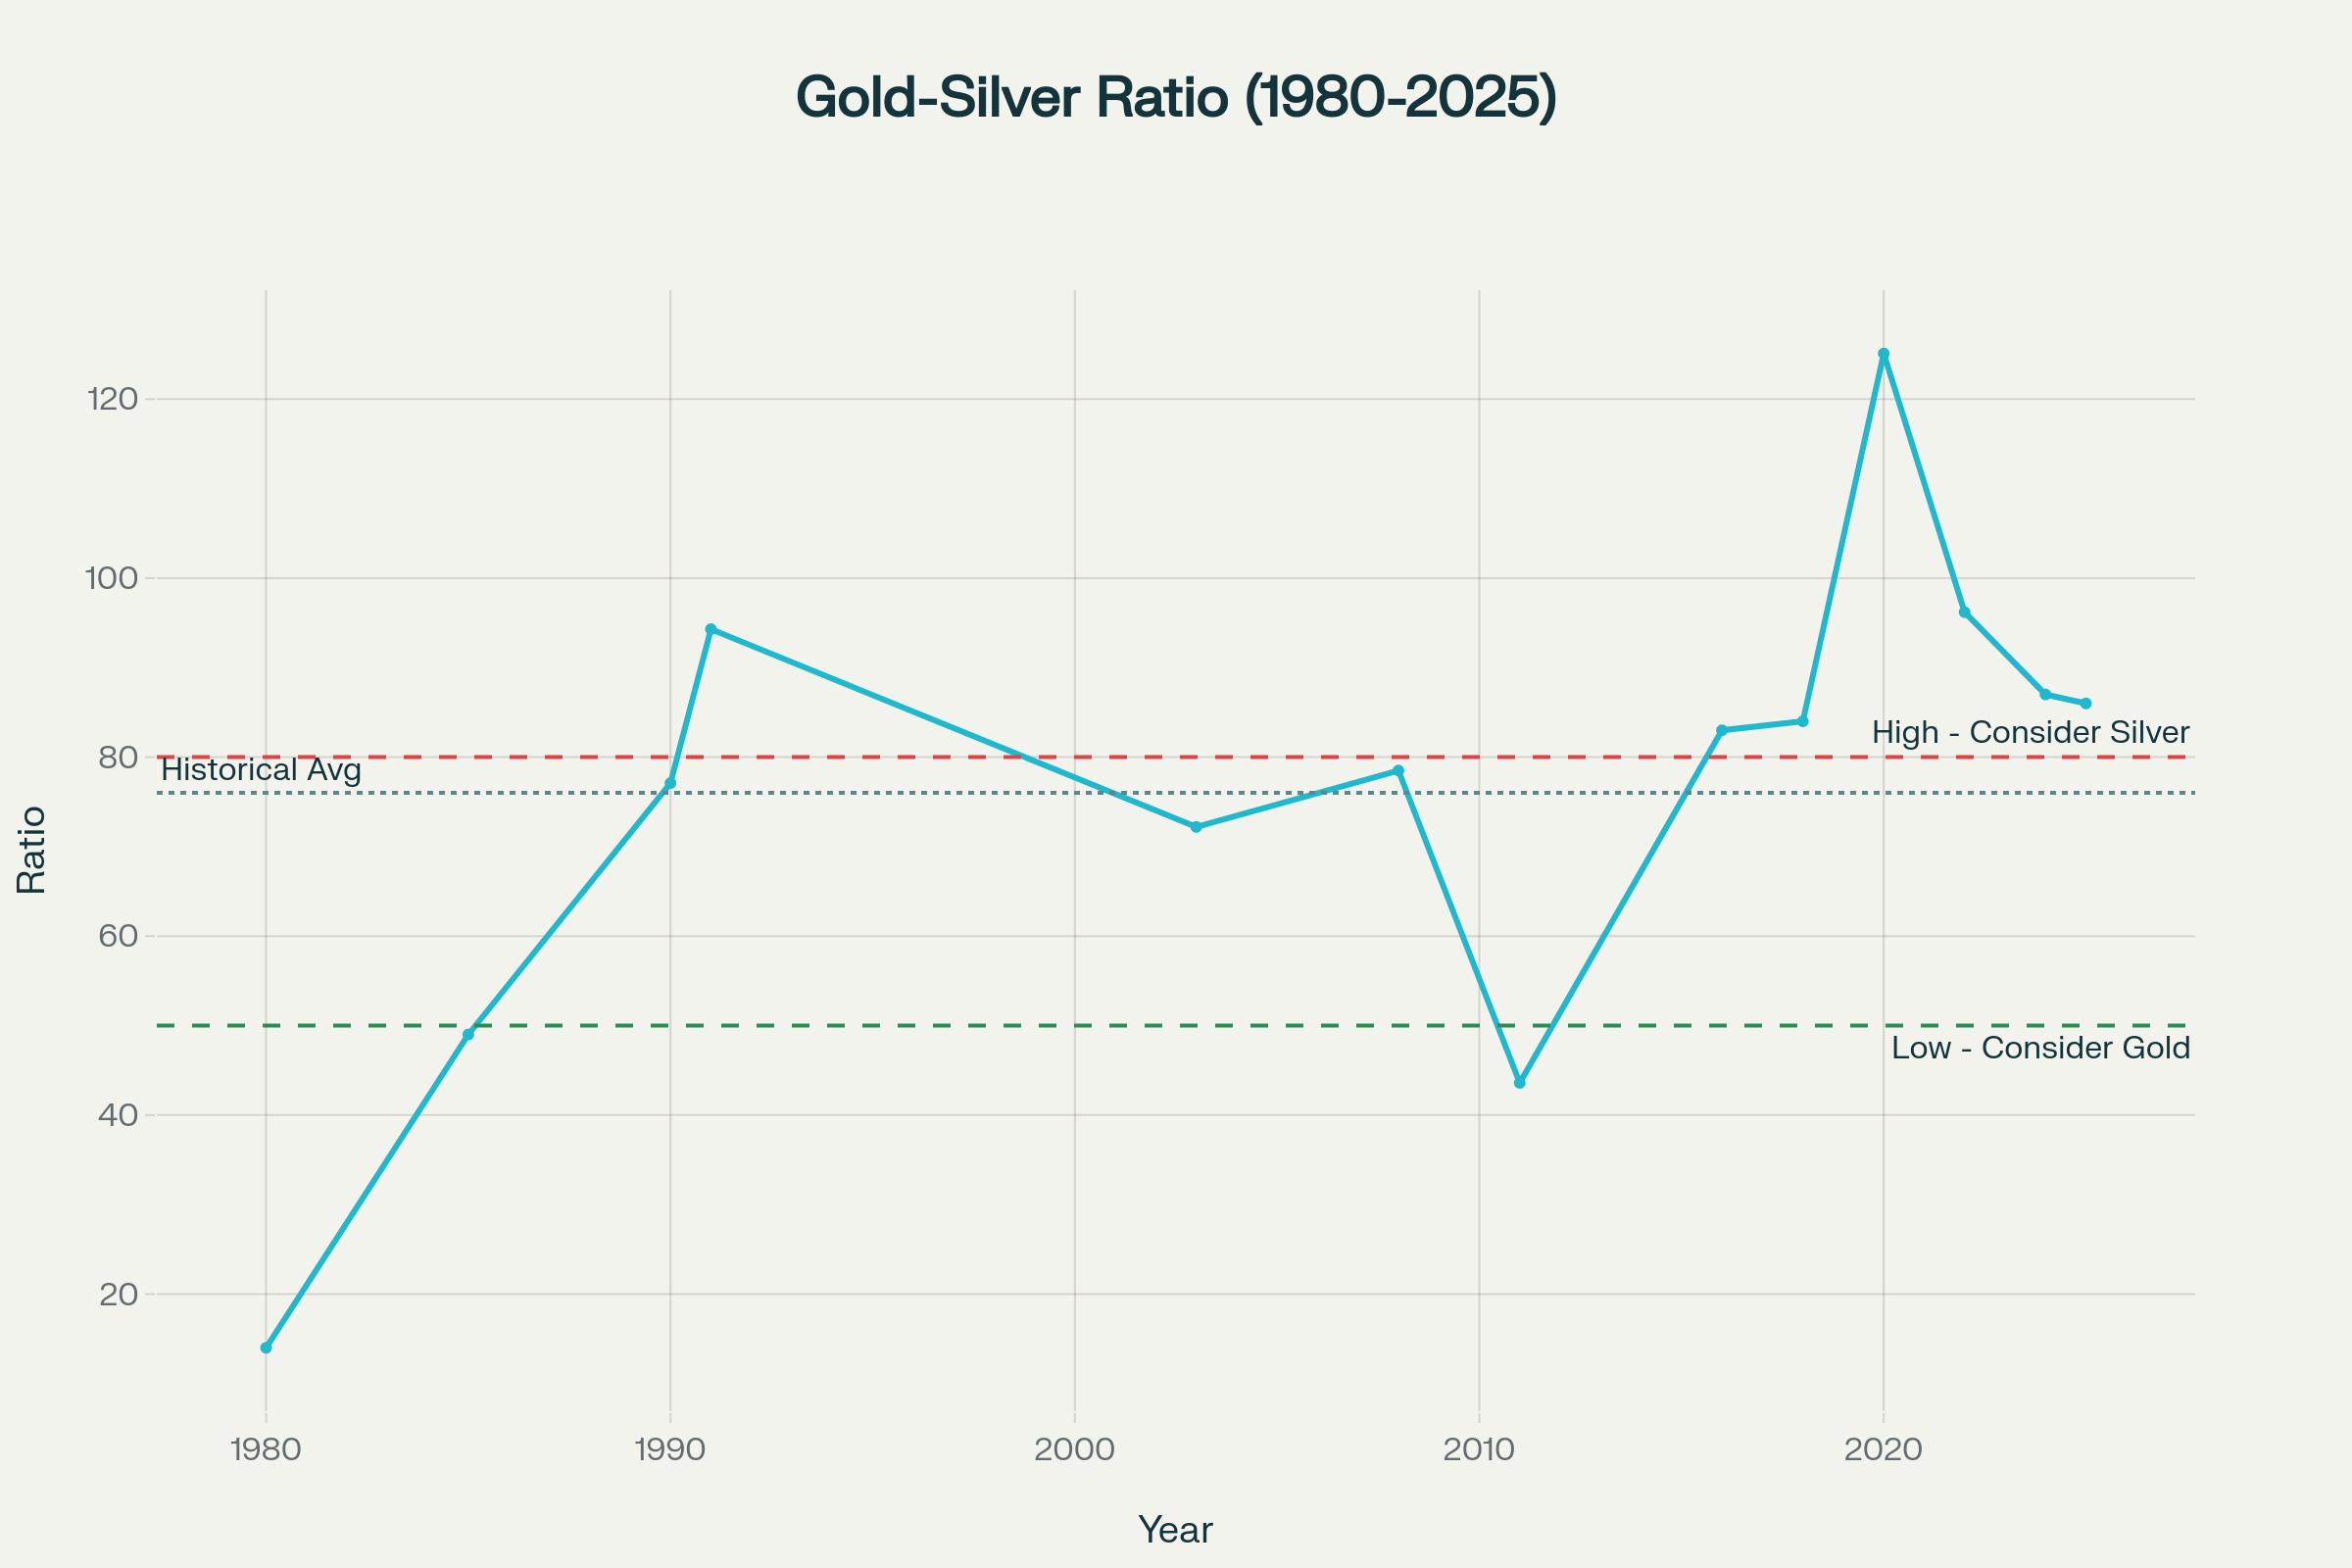
The 21st-century average has been somewhere between 50:1 and 70:1. So at 80:1 today, we’re running historically high—meaning silver is relatively cheap compared to gold.
Why Silver Still Matters (A Lot)
Here’s what makes silver different from gold: it’s not just a store of value—it’s an industrial workhorse.
About 60% of silver demand now comes from industry, compared to only about 10% for gold. Silver has the highest electrical conductivity of any metal, the best thermal conductivity, and unique antimicrobial properties. This makes it absolutely essential for modern technology.
Where’s all this silver going?
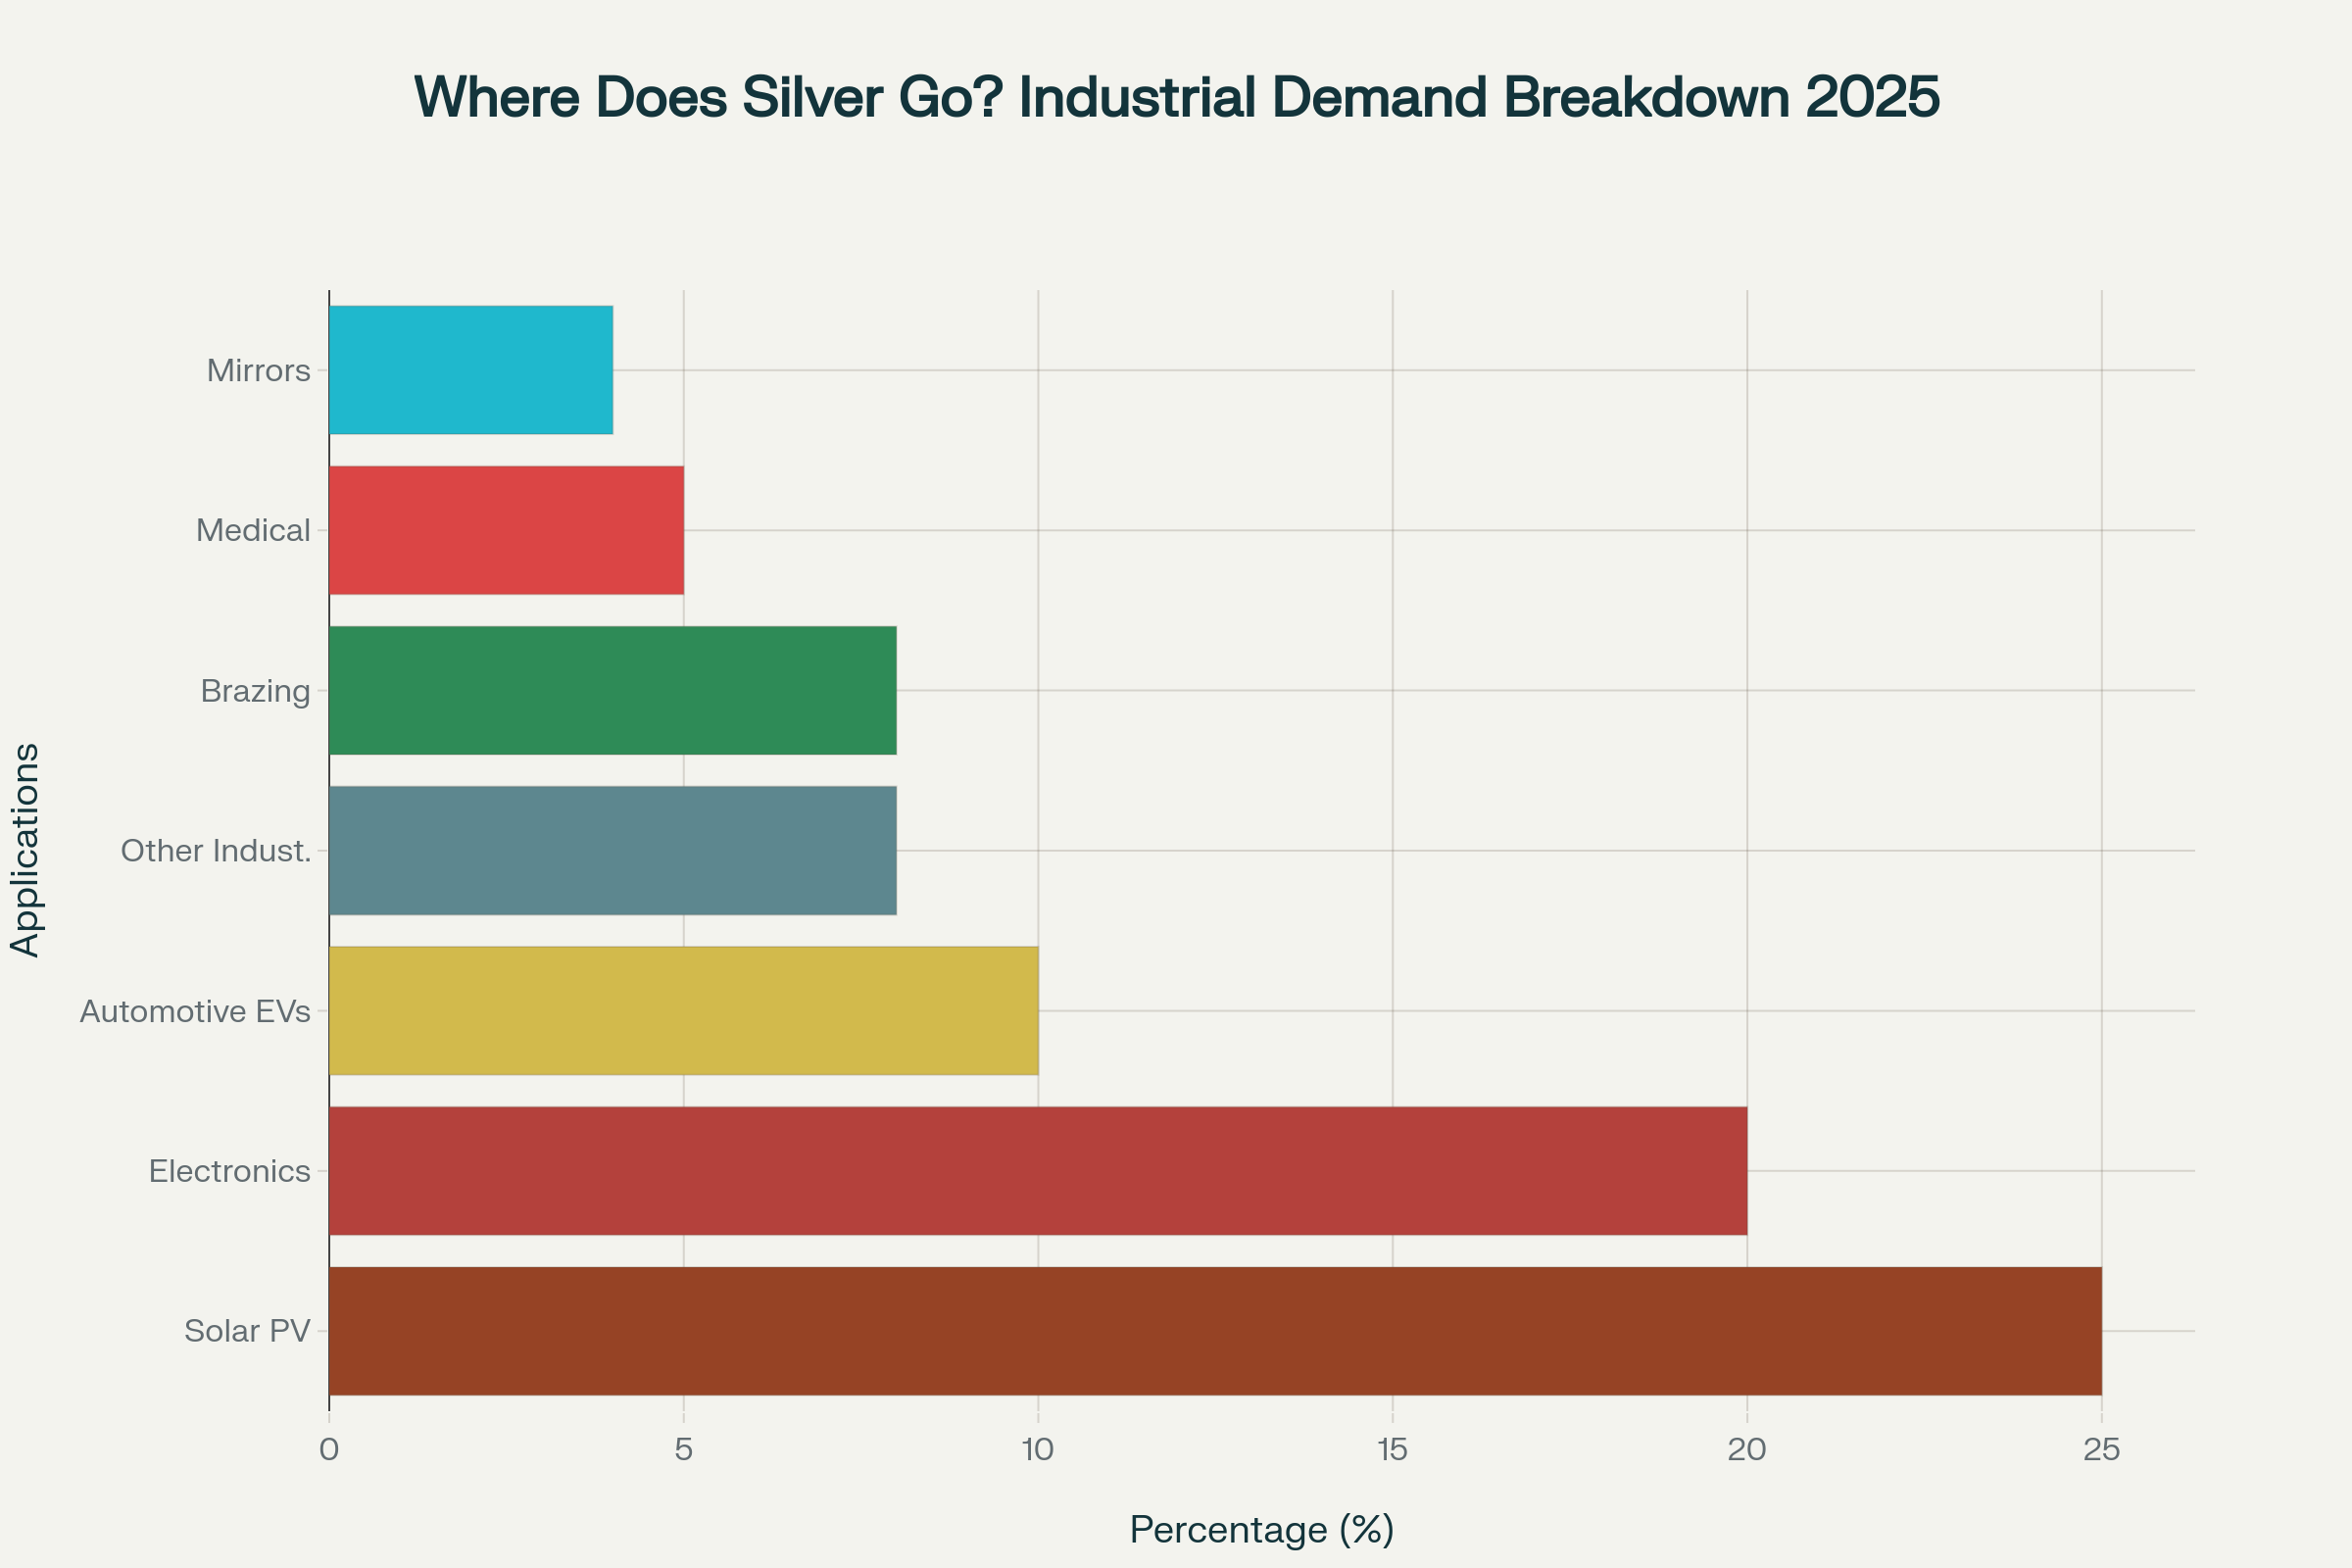
Solar panels are the biggest growth driver—photovoltaics alone account for about 25% of industrial silver use. And here’s the kicker: newer solar panel technologies actually use more silver per panel than older ones. With global solar installations hitting new records every year, that’s a structural demand driver that’s not going away.
Electric vehicles are another huge silver consumer. Every EV uses more silver than a conventional car—in wiring, sensors, battery management systems, and charging infrastructure. As EV adoption grows, so does silver demand.
Electronics and AI are also driving demand higher. The development of artificial intelligence systems is boosting consumer electronics production, and all of it needs silver.
The result? Silver industrial demand hit a record 680.5 million ounces in 2024—the fourth consecutive record. And the market has been in a supply deficit for five straight years now.
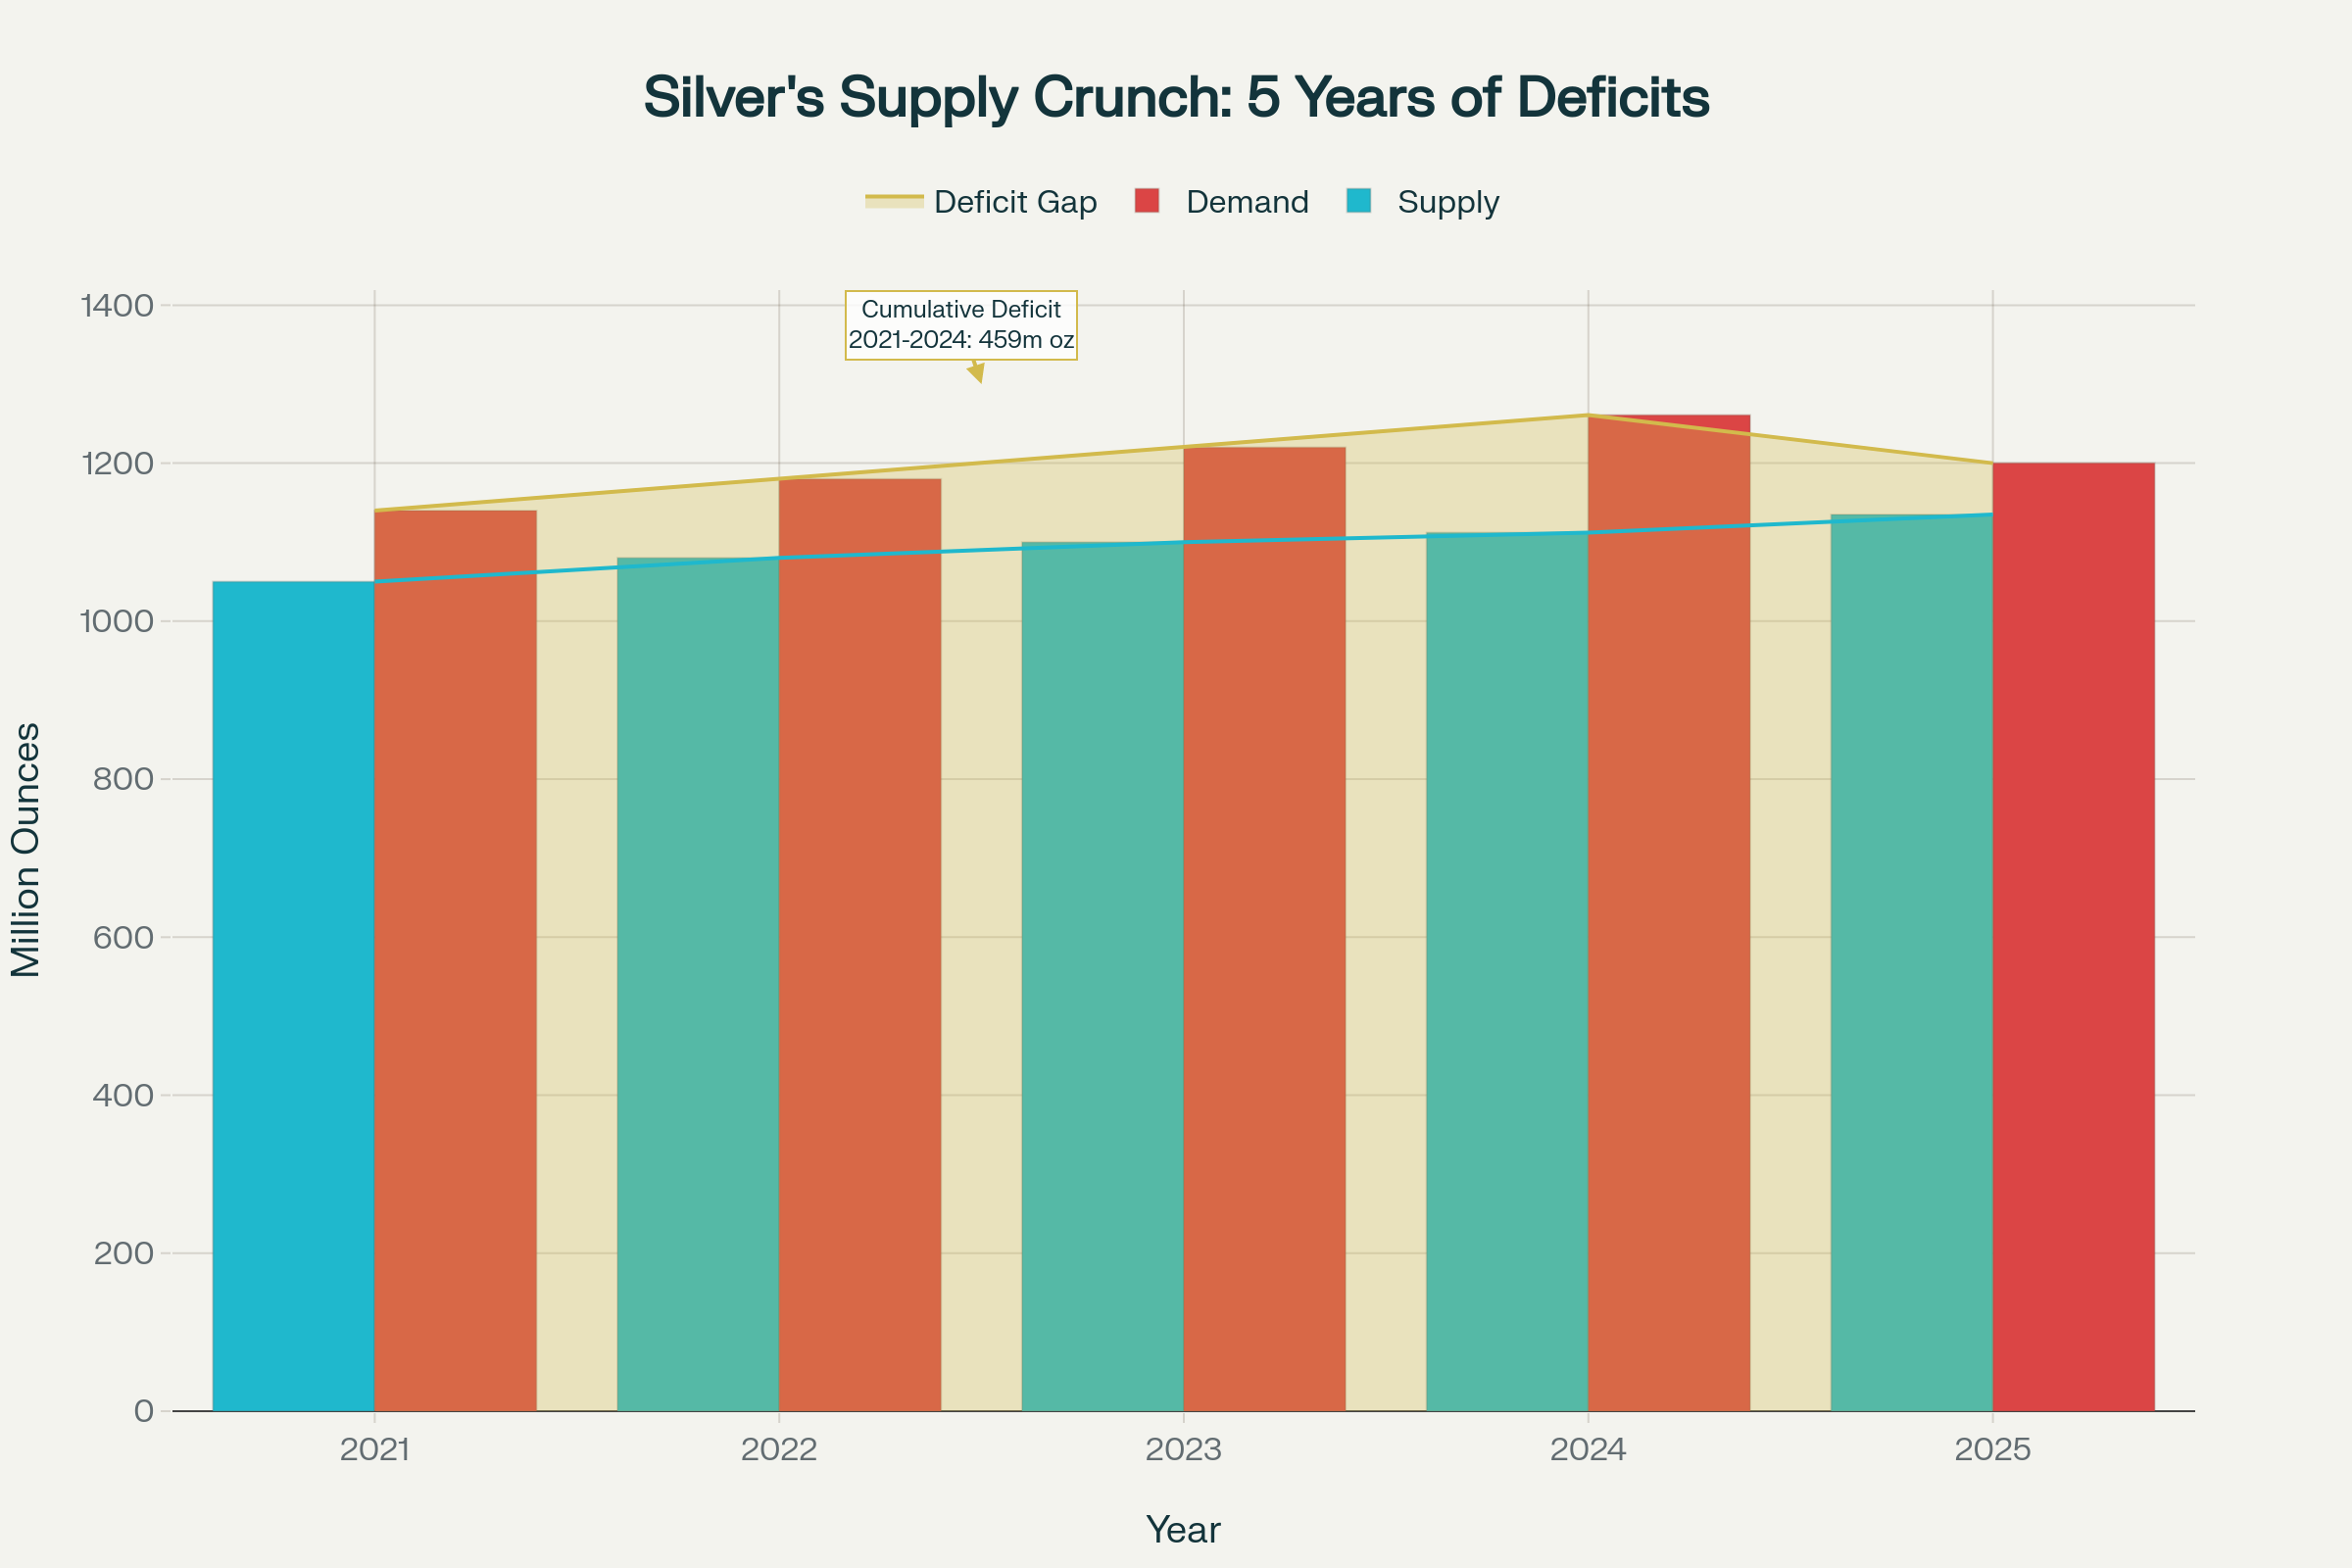
From 2021 to 2024, the cumulative deficit reached 678 million ounces—that’s equivalent to 10 months of global mine supply. Inventories are near decade lows. This supply crunch is real, and it’s persistent.
Gold vs. Silver: The Honest Pros and Cons
Let’s be straight about what you’re getting with each metal.
Gold’s strengths: It’s the ultimate safe haven. When markets panic, gold shines. It’s more stable, less volatile, and has been humanity’s go-to store of value for millennia. It’s also more liquid—easier to sell quickly without moving the market. If you want to preserve wealth and sleep well at night, gold is hard to beat.
Gold’s weaknesses: It’s expensive per ounce, which creates a higher barrier to entry. And because it’s stable, the upside potential is more limited compared to silver’s explosive moves.
Silver’s strengths: It’s affordable—you can start stacking with way less capital. It has that dual nature: monetary asset plus industrial demand. When silver runs, it runs hard—often moving 2x as much as gold in percentage terms. During economic booms, industrial demand surges. During crises, investment demand spikes. Silver wins both ways.
Silver’s weaknesses: Volatility is the price you pay for that upside. Silver can whipsaw violently in short periods. It takes up more storage space per dollar value. And its heavy reliance on industrial demand means it can get hit during recessions when manufacturing slows.
The Ratio Trading Strategy: How Savvy Stackers Multiply Ounces
Here’s where the gold-silver ratio becomes your secret weapon.
The strategy is called “ratio trading,” and it’s beautifully simple: swap between gold and silver at extremes.
The most popular version is the 80-50 rule:
When the ratio hits 80 or higher, silver is cheap relative to gold → swap some gold for silver
When the ratio drops to 50 or lower, gold is cheap relative to silver → swap some silver for gold
Real Performance Data: 2000-2025 Backtest
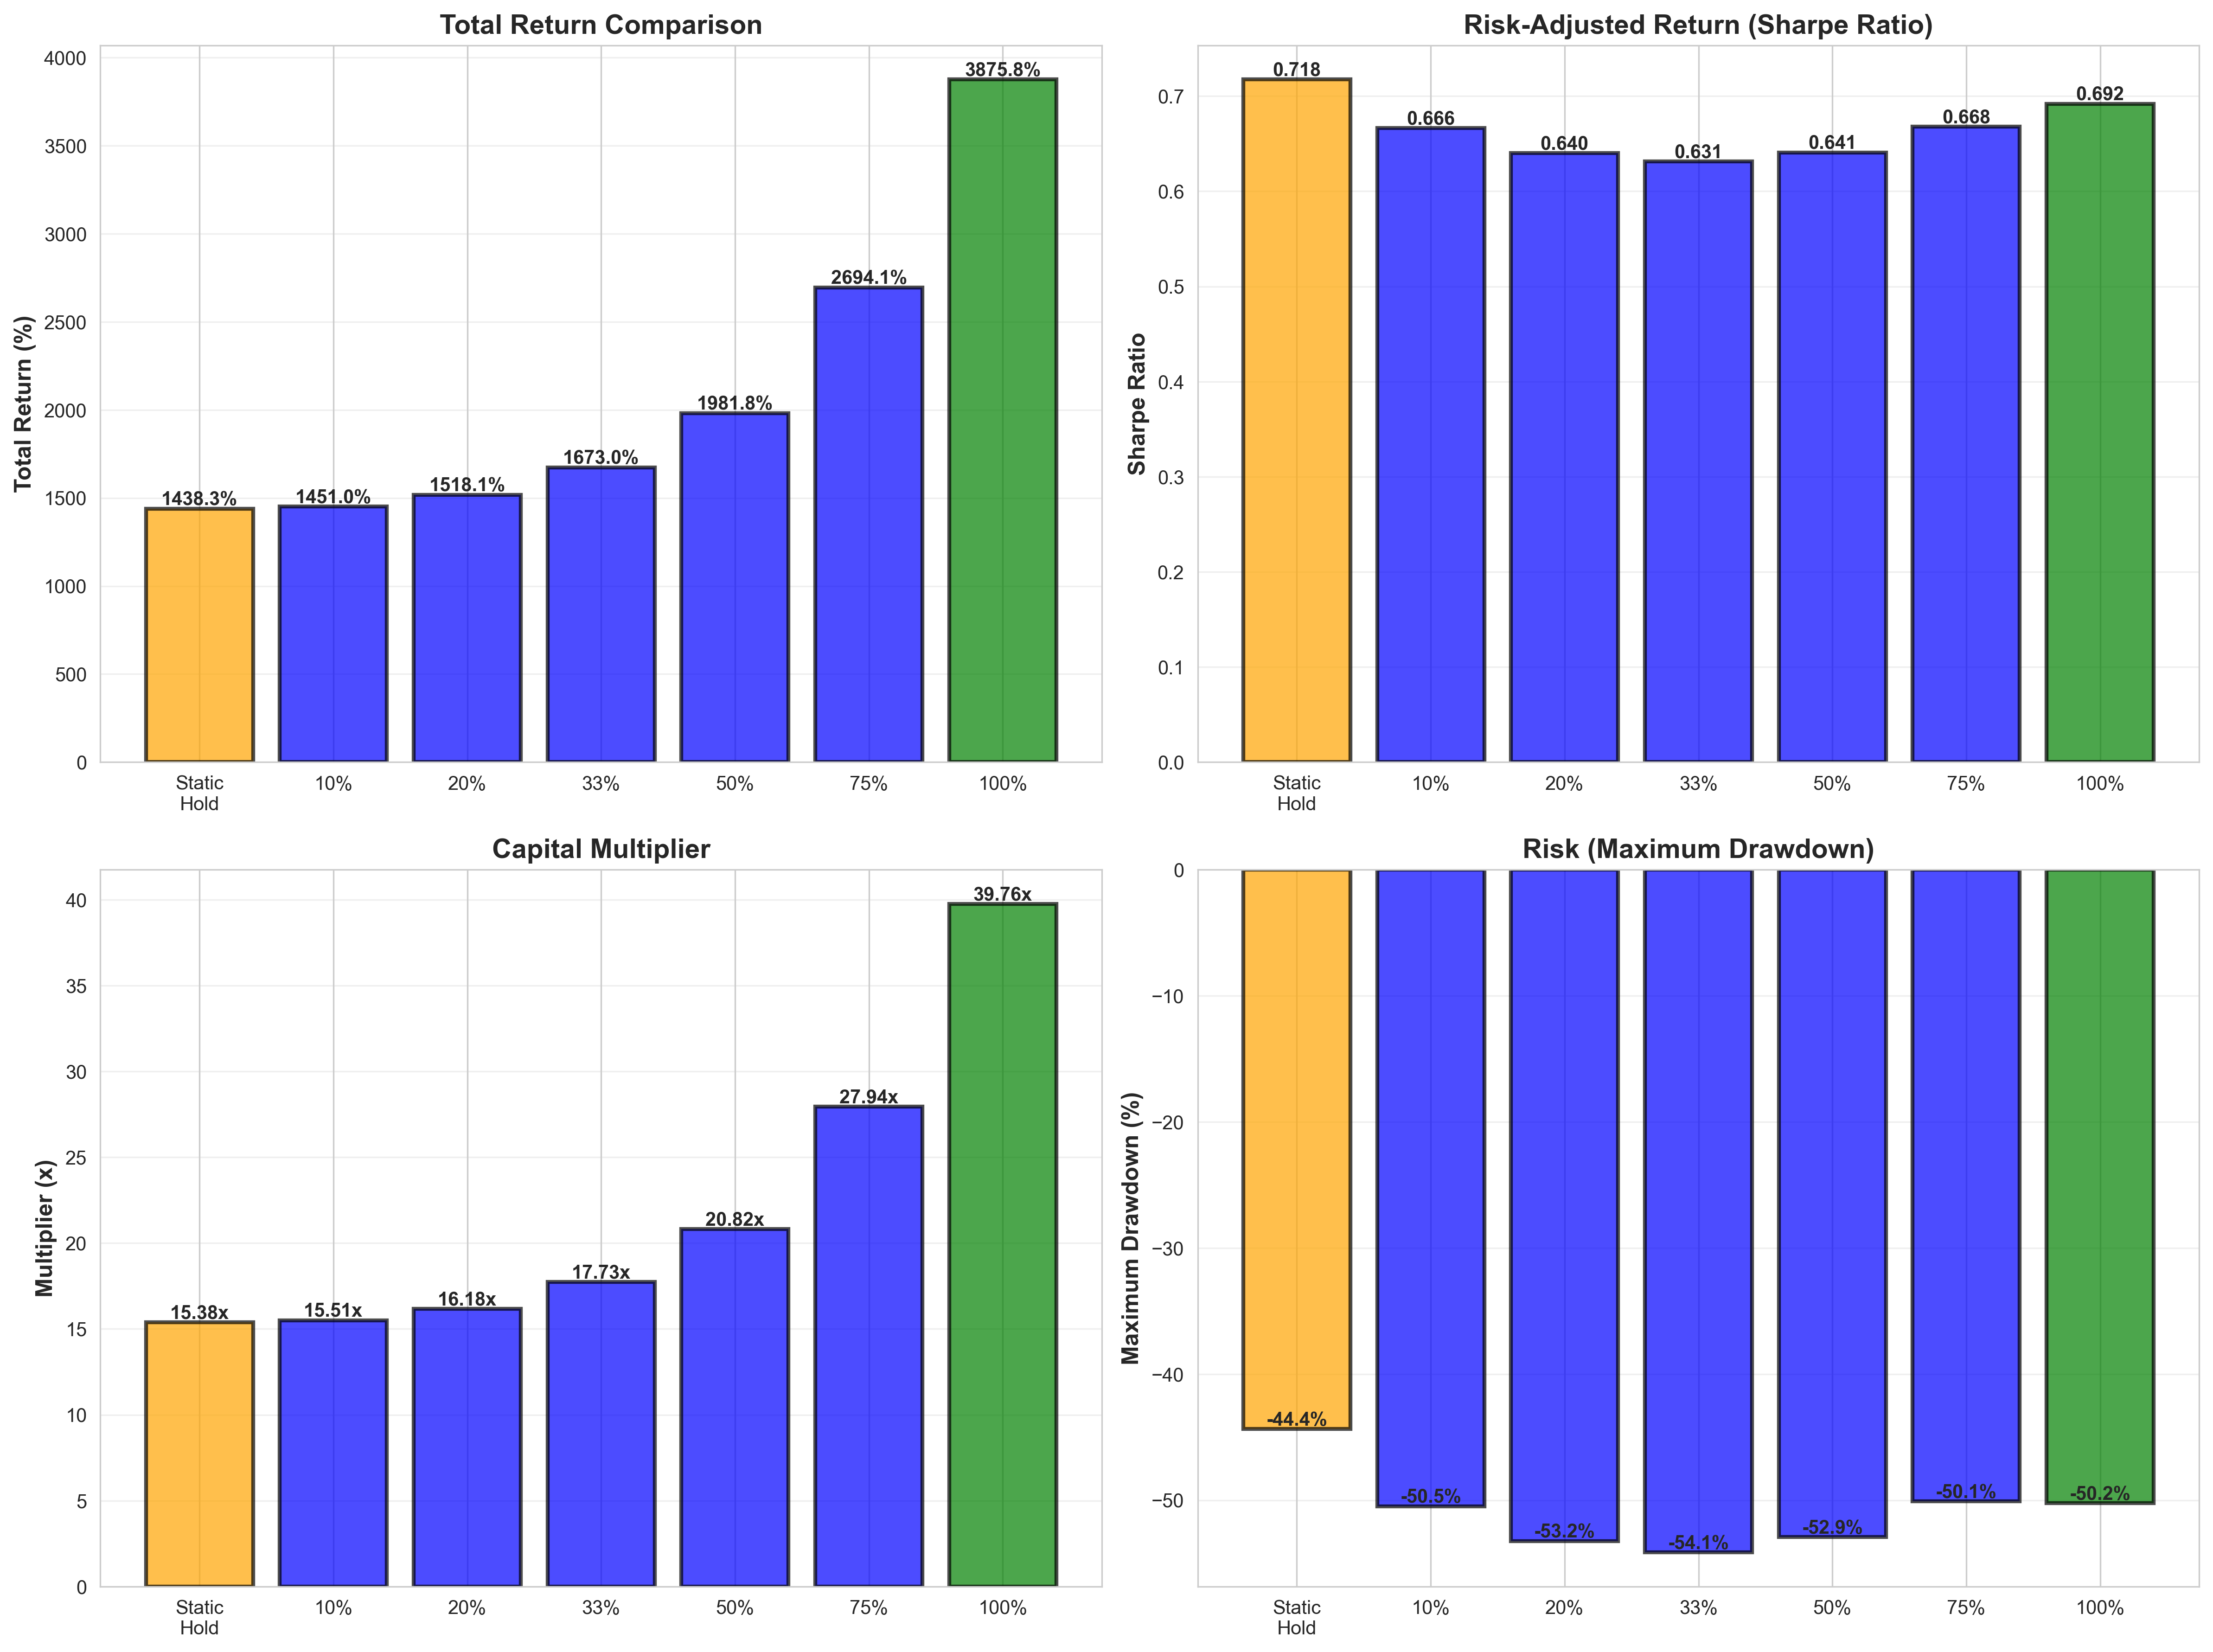
I ran a comprehensive backtest on this strategy using 25 years of actual market data from August 2000 to October 2025—covering 6,306 trading days of real price movements.
Here’s what the numbers actually show:
Static Gold Hold (Baseline):
Total Return: 1,438.26% (15.4x your money)
Sharpe Ratio: 0.7176
Maximum Drawdown: -44.36%
80-50 Ratio Trading Strategy (100% allocation swaps):
Total Return: 3,875.82% (39.76x your money)
Sharpe Ratio: 0.6921
Maximum Drawdown: -50.25%
Total Trades: 5 (one trade every 5 years on average)
The Truth About Performance:
The ratio trading strategy delivered 2.58x better total returns than just holding gold—turning $10,000 into $397,600 instead of $153,800. That’s an extra $243,800 in your pocket.
However, here’s the critical nuance: on a risk-adjusted basis (Sharpe ratio), static gold holding actually performed slightly better. The ratio strategy had higher returns but also higher volatility and a deeper maximum drawdown (-50.25% vs -44.36%).
This means:
If you want maximum total returns and can stomach volatility → ratio trading wins
If you want best risk-adjusted returns and smoother ride → static gold wins
Both strategies crushed inflation and delivered excellent long-term results. The choice depends on your risk tolerance and investment goals.
What the Historical Ratio Tells Us Right Now
At 80:1 today, we’re in ratio trade territory. Silver is historically undervalued compared to gold.
Looking at the backtest data, when the ratio has peaked above 80 in the past 25 years, silver has consistently rallied as the ratio compressed back toward its mean. The pattern has held through multiple market cycles, including the 2008 financial crisis and the 2020 COVID panic.
Right now in 2025, silver has already surged 45% year-to-date to around $53/oz, but the ratio remains elevated at 80:1. Many analysts believe there’s more room to run as the ratio compresses toward its historical average of 50-70:1.
What Should a Coin Stacker Do Right Now?
Here’s a practical approach based on the actual data:
If you’re starting fresh: Consider a balanced approach. Maybe 50-60% gold, 40-50% silver. You get diversification benefits while positioning for potential silver upside.
If you’re heavy in gold: Think about converting 10-20% to silver. You don’t have to go all-in—partial rebalancing captures some upside while limiting risk.
If you’re all silver: Hold your position, but consider taking some profits if the ratio drops to 60 or below.
Understanding the volatility trade-off: The backtest shows ratio trading can deliver higher returns, but with a deeper maximum drawdown (-50.25%). Make sure you can psychologically handle a 50% paper loss without panic selling.
Dollar-cost average: Instead of trying to time the perfect entry, stack consistently. Buy a bit of both every month, but tilt your purchases toward silver while the ratio stays elevated above 70.
Watch the 50-60 level: If the ratio compresses to this range, that’s historically been a signal to start shifting back toward gold.
Don’t forget transaction costs: The backtest assumes perfect execution. In reality, premiums, spreads, and taxes will reduce your returns. Factor these into your decision-making.
The Bottom Line
The gold-silver ratio isn’t magic—it’s just math plus history. Based on my analysis of 25 years of rigorous backtesting, the data shows that ratio trading can significantly outperform static gold holding in terms of total returns, but with the trade-off of higher volatility and deeper drawdowns.
Right now, at 80:1, silver is offering you more ounces per dollar than historical norms suggest it should. Combined with structural supply deficits, record industrial demand, and a persistent under-supply situation, the setup looks compelling.
Gold will always have its place as the ultimate wealth preserver with superior risk-adjusted returns. But if you’re a coin stacker looking to maximize total returns over time and can handle the volatility, understanding and using the gold-silver ratio might be a valuable edge.
The choice between maximum returns (ratio trading) and best risk-adjusted returns (static gold) is yours. Both paths have proven successful over the past quarter-century.
Stack smart. Stack patient. And let the data guide your decisions.
Disclaimer: This article is for educational purposes only and does not constitute financial advice. Precious metals investing carries risks. Past performance does not guarantee future results. The backtest results shown are hypothetical and do not account for transaction costs, taxes, premiums, or slippage. Do your own research and consider consulting a financial advisor before making investment decisions.