
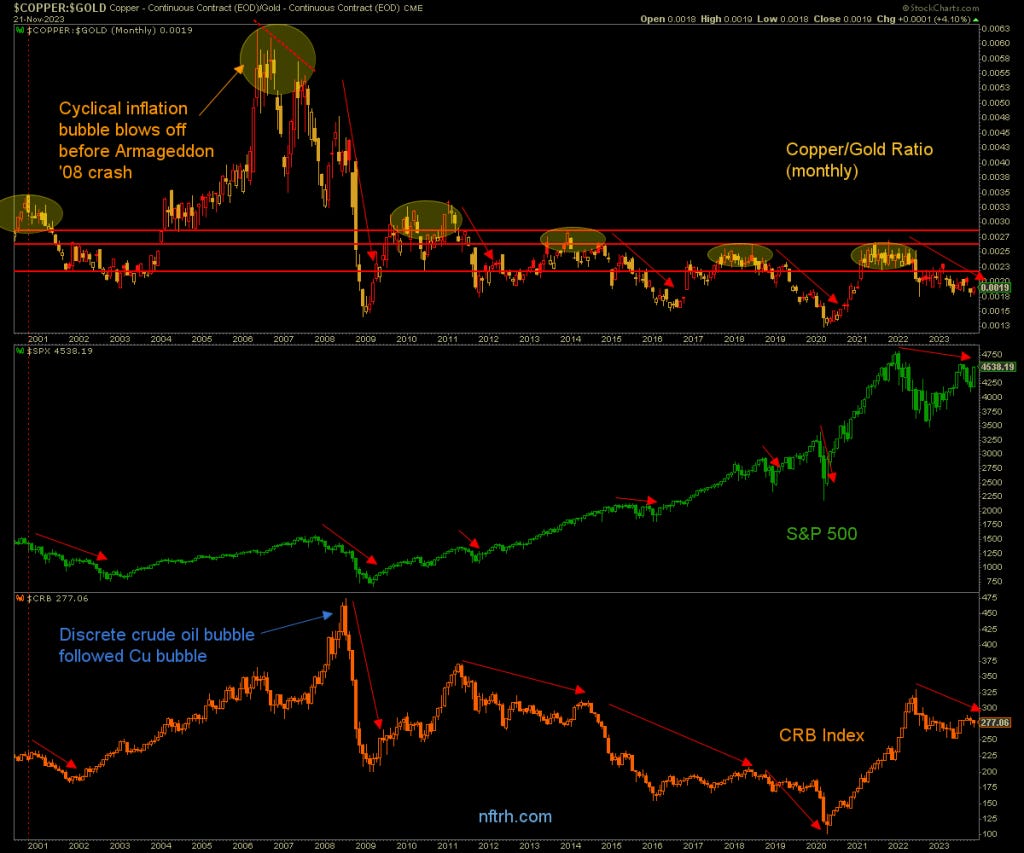
The copper-to-gold ratio might be the most underappreciated indicator in your market analysis toolkit. While most investors obsess over Fed minutes and earnings reports, this simple calculation—dividing copper prices by gold prices—has quietly become one of the most reliable economic barometers we have. And right now, it’s flashing some serious warning signals.
What Exactly Is the Copper/Gold Ratio?
Think of the copper/gold ratio as the market’s way of measuring optimism versus pessimism in real-time. The calculation is straightforward: take the price of copper per ounce, divide it by the price of gold per ounce, and you get a number that tells a powerful story about where the global economy is headed.
Copper is “Dr. Copper”—the industrial metal that powers everything from construction to electronics. When economies are humming, copper demand soars. It’s pure economic growth in commodity form.
Gold, on the other hand, is the ultimate insurance policy. When investors get nervous about inflation, geopolitical tensions, or economic uncertainty, they flock to gold like moths to a flame.
So when you divide copper by gold, you’re essentially measuring industrial confidence against financial fear. A rising ratio means the world believes in growth. A falling ratio? Time to batten down the hatches.
Record Lows and What They Mean
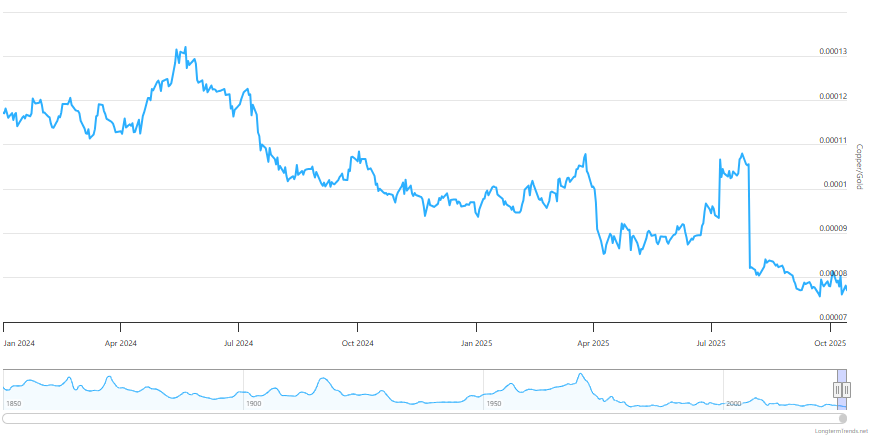
Here’s where things get interesting—and a bit scary. The copper/gold ratio has plummeted to levels not seen in 50 years. We’re talking about readings that make the 2008 financial crisis look like a minor blip.
Current readings show the ratio sitting at approximately 0.00077—the lowest point since 1850 according to some measures. To put this in perspective, this is lower than:
The 1980 stagflation crisis (0.00086)
The 2008 financial meltdown (0.00110)
The 2020 COVID pandemic (0.00084)
What makes this particularly striking is that copper isn’t collapsing—it’s actually up around 10% this year. The problem is that gold has been absolutely on fire, surging more than 30% in 2025 alone. Gold has reached historic highs above $4,100 per ounce, while copper, despite some volatility, has remained relatively range-bound.

The Bond Market Connection
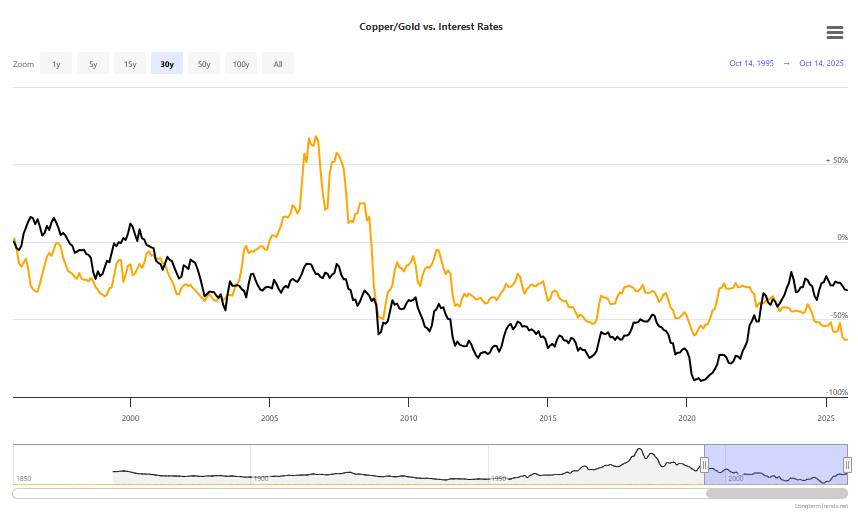
One of the most fascinating aspects of the copper/gold ratio is its uncanny ability to predict interest rates. The relationship is so strong that legendary bond manager Jeffrey Gundlach has called it one of his favorite leading indicators.
The logic is elegant: when the copper/gold ratio rises, it suggests economic expansion is coming, which typically leads to higher inflation expectations and rising bond yields. When the ratio falls, as it’s doing now, it often precedes falling interest rates as central banks respond to weakening economic conditions.
Historically, the correlation between the copper/gold ratio and 10-year Treasury yields has been remarkably strong, hovering around 0.85. However, this relationship has become somewhat strained in recent years due to extraordinary monetary policy interventions.
What’s Driving the Current Collapse?
Several factors are converging to push this ratio to historic lows:
1. Geopolitical Uncertainty
From US-China trade tensions to ongoing conflicts in Europe and the Middle East, investors are seeking safe havens. Gold’s role as the ultimate “chaos hedge” has never been more relevant.
2. Central Bank Gold Buying
Central banks have been net buyers of gold on an unprecedented scale. This institutional demand has helped push gold prices to new highs while providing a floor under prices.
3. Inflation Concerns
Despite central bank efforts, inflation remains a persistent worry. Gold’s traditional role as an inflation hedge has attracted both institutional and retail investors.
4. Industrial Demand Concerns
While copper hasn’t crashed, concerns about global industrial demand—particularly from China—have kept a lid on significant price appreciation.
The Track Record: When the Ratio Has Been This Low Before
History suggests that extreme readings in the copper/gold ratio often mark important turning points. Looking at past episodes:
The 1970s Stagflation Era: The ratio collapsed as inflation soared and central banks struggled to maintain control. Gold became the go-to asset while industrial metals languished.
2008 Financial Crisis: The ratio plummeted as the global economy seized up. However, it rebounded sharply during the subsequent recovery as industrial demand returned.
2020 COVID Pandemic: A brief but sharp decline was followed by a strong recovery as stimulus measures and reopening boosted industrial demand.
The key insight is that these extreme readings often precede major shifts in market sentiment and economic policy.
Trading and Investment Implications
For investors, the current copper/gold ratio readings suggest several potential strategies:
Risk Management: The ratio is screaming “risk-off,” suggesting defensive positioning may be warranted. This could mean reducing exposure to cyclical stocks and increasing allocations to defensive sectors.
Currency Markets: Commodity-linked currencies like the Australian dollar and Canadian dollar often struggle when the copper/gold ratio is this low. Conversely, safe-haven currencies like the Japanese yen and Swiss franc may outperform.
Sector Rotation: Industrial and materials stocks may face headwinds, while defensive sectors like utilities and consumer staples could benefit.
Fixed Income: The ratio’s predictive power for bond yields suggests rates may be headed lower, potentially benefiting long-duration bonds.

The Contrarian Case
Not everyone believes the ratio’s current message of doom and gloom. Some analysts argue that structural changes in both markets may be distorting the traditional relationship:
Gold’s new role: Central bank buying and its evolving role as a “currency hedge” may have permanently altered gold’s pricing dynamics
Copper’s green premium: The metal’s critical role in renewable energy and electrification may provide a demand floor that didn’t exist in previous cycles
Market structure changes: The growth of ETFs and algorithmic trading may have changed how these markets interact
What to Watch Going Forward
Several key factors could signal a turn in the copper/gold ratio:
1. Chinese Stimulus: Any meaningful economic support from Beijing could boost copper demand and lift the ratio.
2. US Economic Data: Strong employment and GDP numbers could shift sentiment back toward growth assets.
3. Federal Reserve Policy: A pause or reversal in monetary tightening could alter the gold dynamic.
4. Geopolitical Developments: Any easing of global tensions could reduce safe-haven demand for gold.
The Bottom Line
The copper/gold ratio is currently sending the strongest risk-off signal in five decades. While this doesn’t guarantee a market crash or recession, it does suggest that significant pessimism is already baked into asset prices.
For contrarian investors, this level of pessimism might represent opportunity. History shows that when everyone is expecting the worst, markets often surprise to the upside. But for now, the message from this time-tested indicator is clear: caution is warranted.
Whether you’re a seasoned macro trader or simply trying to position your portfolio for what’s ahead, the copper/gold ratio deserves a spot on your dashboard. In a world of noisy economic data and conflicting signals, sometimes the simplest ratios tell the most powerful stories.
The views expressed are for informational purposes only and should not be considered investment advice. Past performance does not guarantee future results.